Fig. 5
Download original image
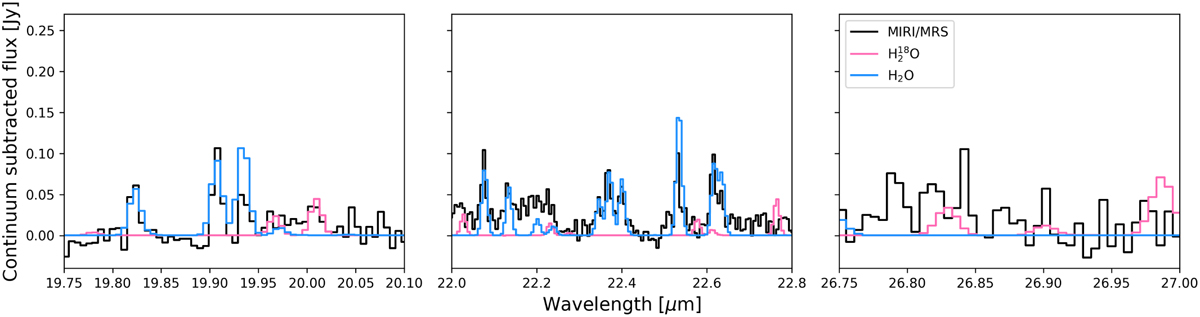
Different regions where H218O is expected to show lines sufficiently isolated from H2O. These lines are not seen in the spectrum, compared a H218O slab models assuming the same best-fit parameters as H2O in these regions, assuming a 16O/18O of 550. The models have been multiplied by 5 for visibility. The H2O slab models are based on the best-fit parameters presented in Table 1 per wavelength region.
Current usage metrics show cumulative count of Article Views (full-text article views including HTML views, PDF and ePub downloads, according to the available data) and Abstracts Views on Vision4Press platform.
Data correspond to usage on the plateform after 2015. The current usage metrics is available 48-96 hours after online publication and is updated daily on week days.
Initial download of the metrics may take a while.