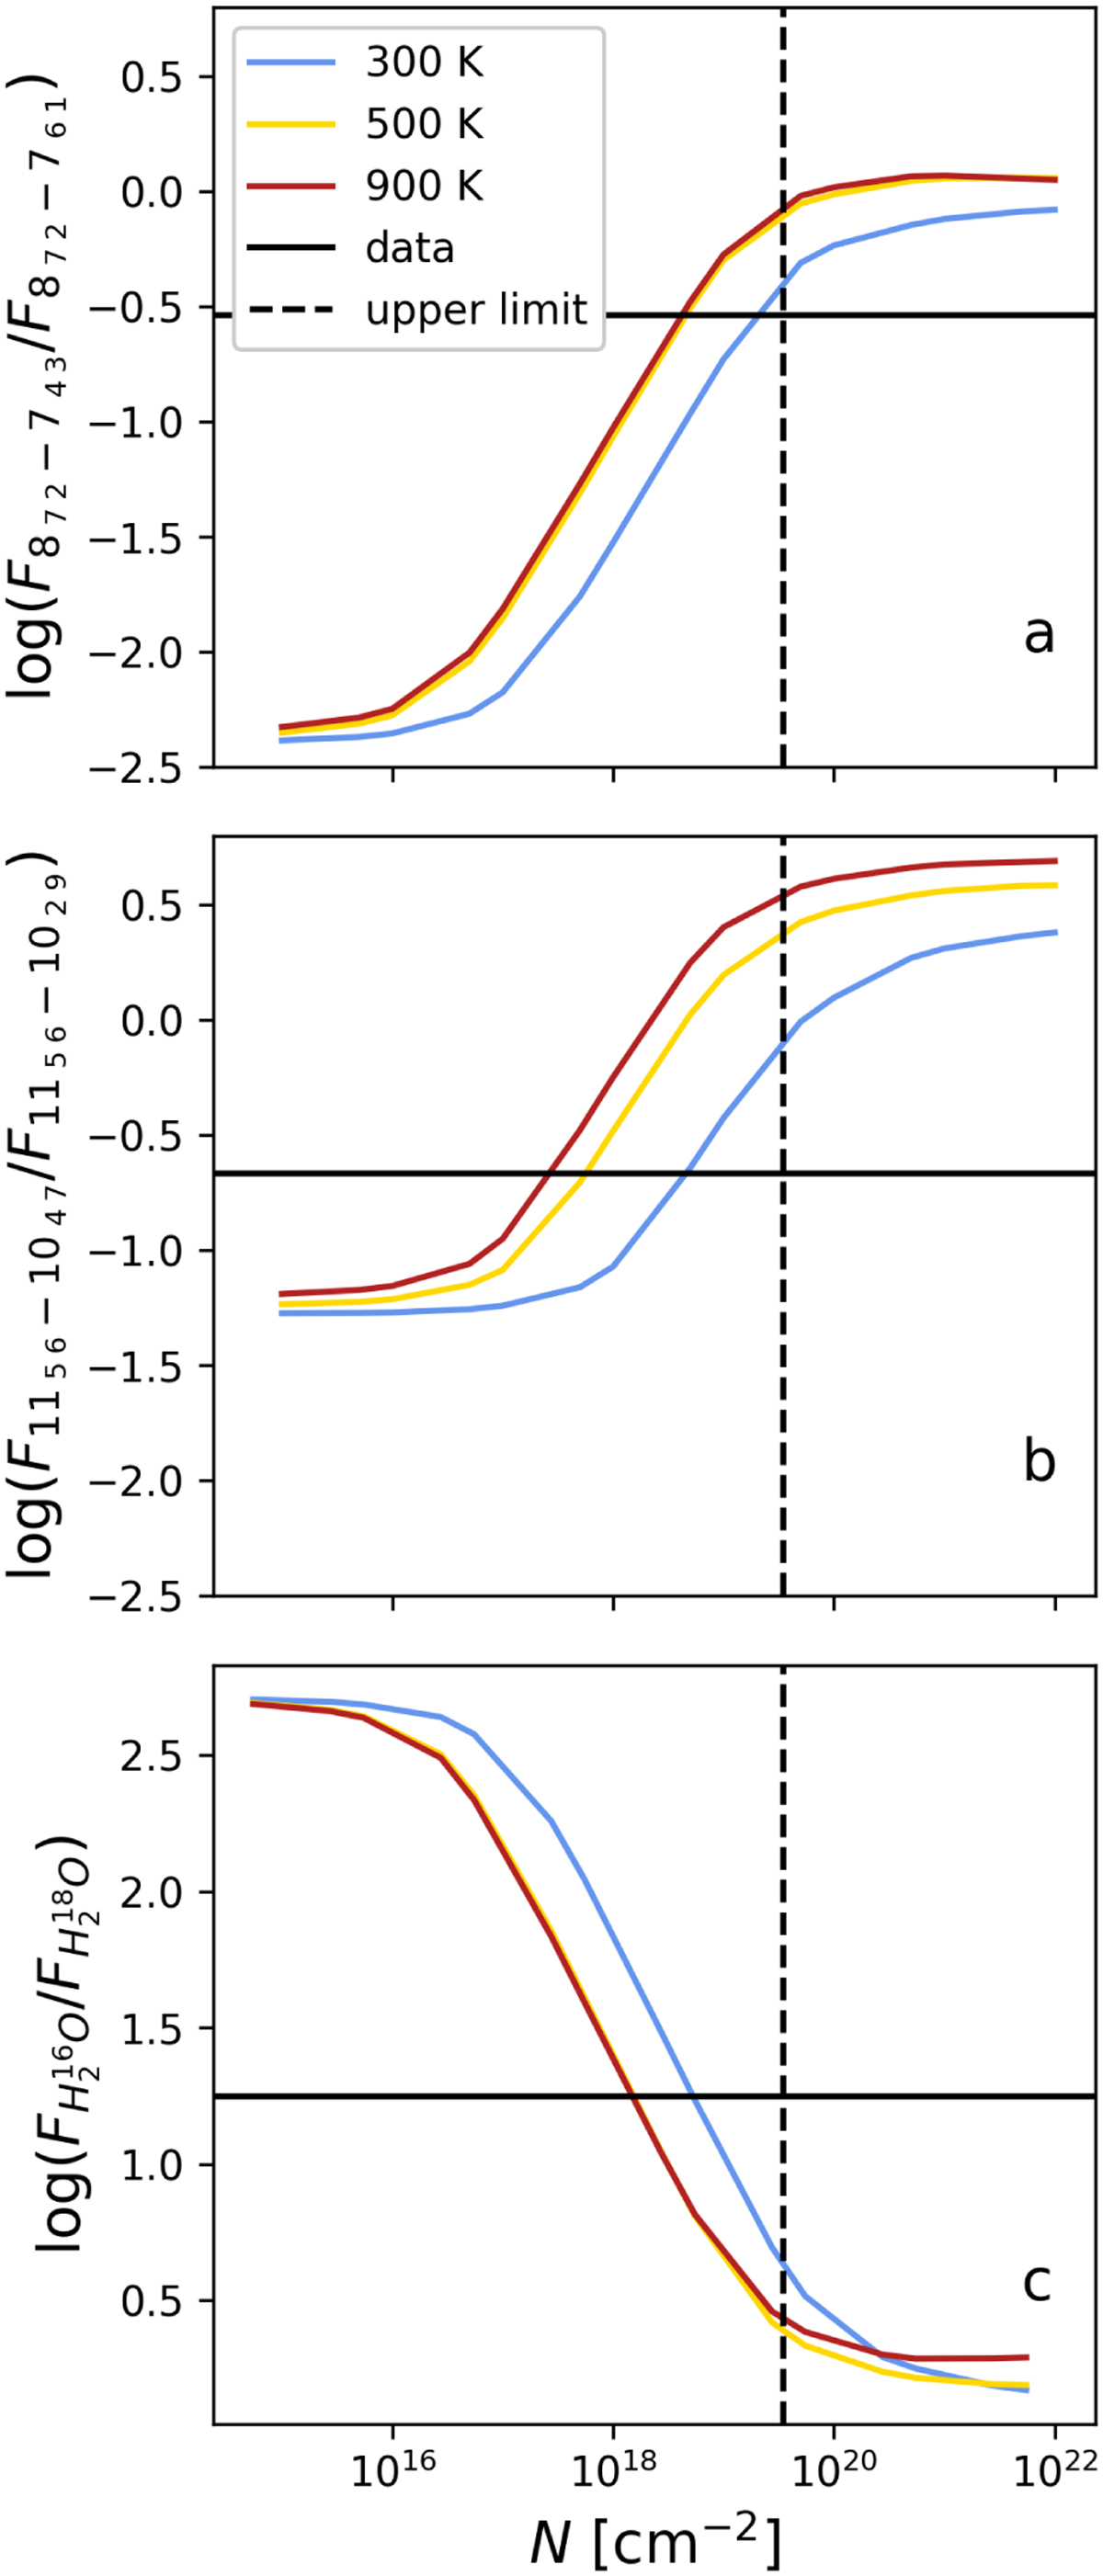
Fig. 4
Download original image
Flux ratios of H216O lines of the same upper level in the data compared to slab models (top); and H216O/H218O ratio in the data and slab models (bottom). The properties of the transitions can be found in Table 2. The dotted black vertical line indicates the upper limit of the column density based on the 1σ level of the spectrum and the nondetection of the H218O line. The x-axis shows the column density of H216O. In the bottom panel, H216O/H218O ratio of 550 is assumed.
Current usage metrics show cumulative count of Article Views (full-text article views including HTML views, PDF and ePub downloads, according to the available data) and Abstracts Views on Vision4Press platform.
Data correspond to usage on the plateform after 2015. The current usage metrics is available 48-96 hours after online publication and is updated daily on week days.
Initial download of the metrics may take a while.