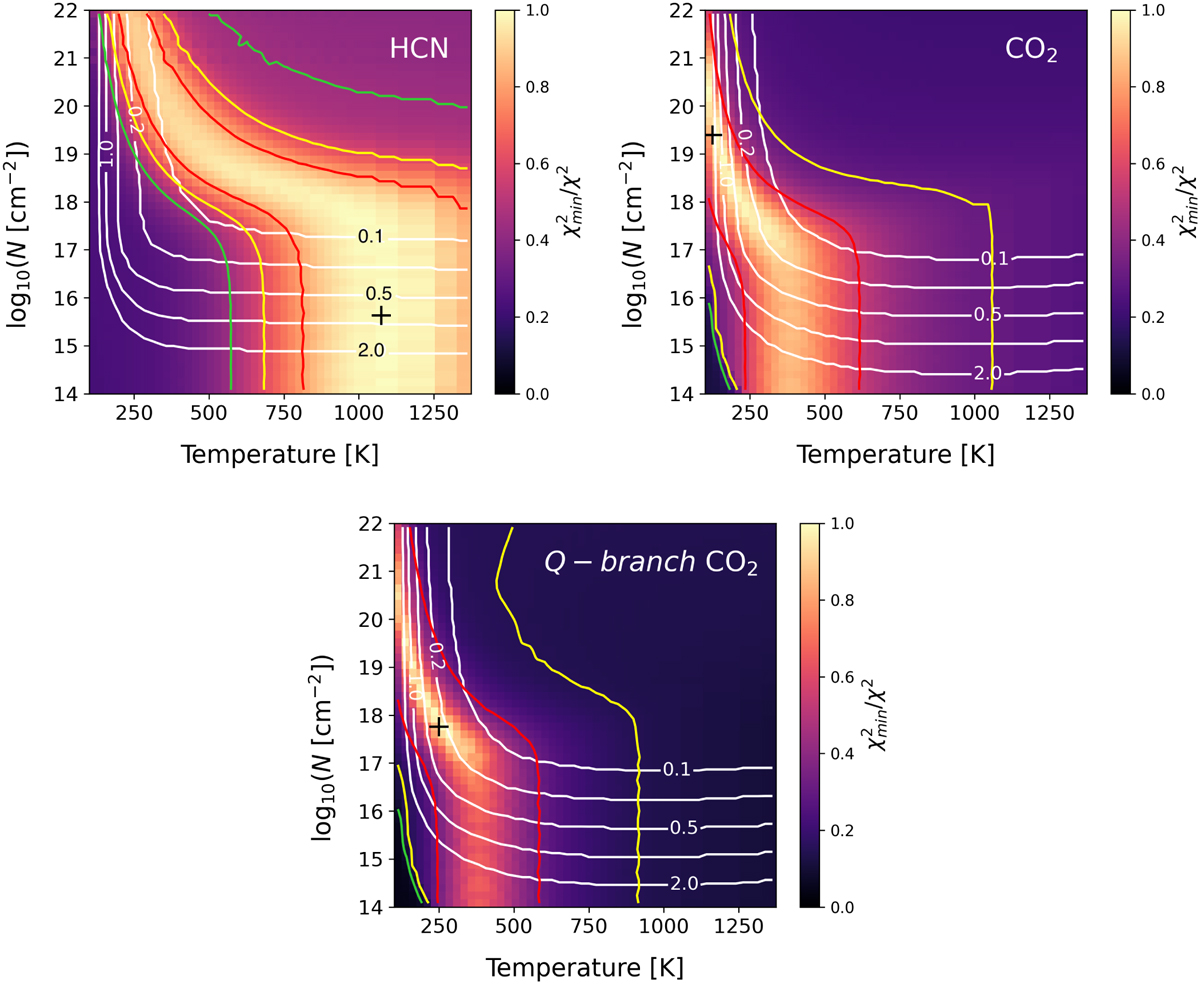
Fig. A.2
Download original image
χ2 plots of HCN and CO2 detected in region 2. The red, yellow, and green lines indicate the 1σ, 2σ, and 3σ confidence contours, respectively. The white contours show the emitting radii in astronomical units (0.1 to 2.0 au). The black cross corresponds to the best fit. The bottom plot shows the map for CO2 when fitting the Q-branch only.
Current usage metrics show cumulative count of Article Views (full-text article views including HTML views, PDF and ePub downloads, according to the available data) and Abstracts Views on Vision4Press platform.
Data correspond to usage on the plateform after 2015. The current usage metrics is available 48-96 hours after online publication and is updated daily on week days.
Initial download of the metrics may take a while.