Fig. 9.
Download original image
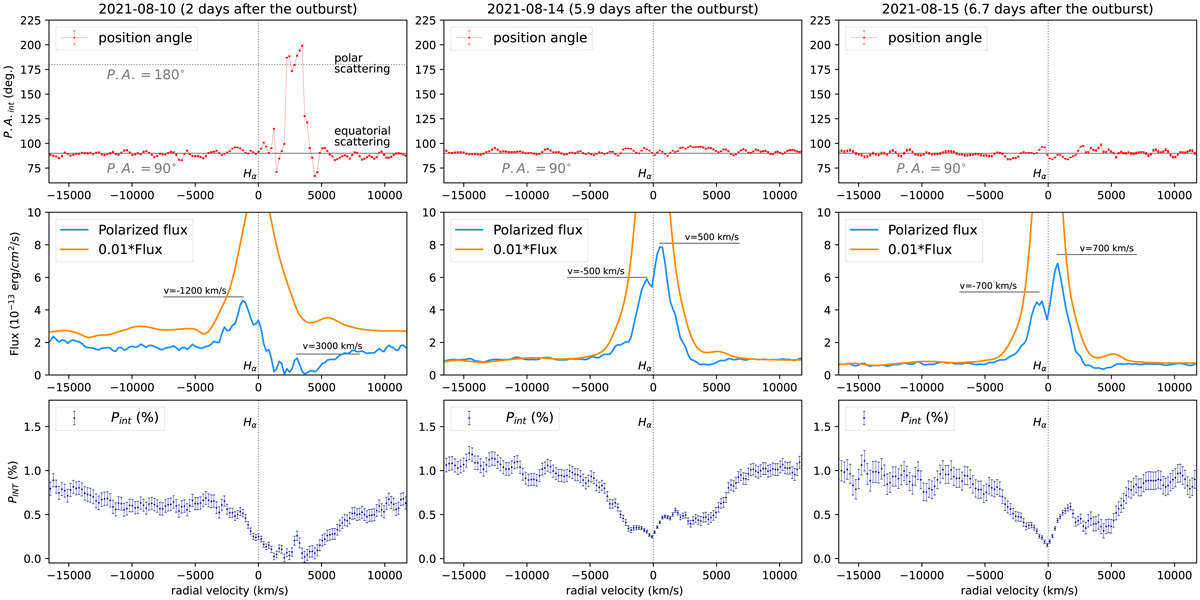
Evolution of the polarized flux across the Hα emission line. The position angles (PA) are presented in red in the first row from day 2 (left) to day 6.7 (right) into the 2021 outburst. The PA on the 2nd day into the outburst (left column, top) shows a complex structure. The evolution of the polarized flux (in blue) and 0.01*flux (in orange) are presented in the second row. Asymmetries in the blue- and red-shifted peaks of the polarized flux are well visible. In the third row, the degree of polarization is presented.
Current usage metrics show cumulative count of Article Views (full-text article views including HTML views, PDF and ePub downloads, according to the available data) and Abstracts Views on Vision4Press platform.
Data correspond to usage on the plateform after 2015. The current usage metrics is available 48-96 hours after online publication and is updated daily on week days.
Initial download of the metrics may take a while.