| Issue |
A&A
Volume 679, November 2023
|
|
|---|---|---|
| Article Number | A150 | |
| Number of page(s) | 9 | |
| Section | Stellar structure and evolution | |
| DOI | https://doi.org/10.1051/0004-6361/202346997 | |
| Published online | 30 November 2023 | |
Transient and asymmetric dust structures in the TeV-bright nova RS Oph revealed by spectropolarimetry
1
Institute of Astronomy and National Astronomical Observatory, Bulgarian Academy of Sciences, 72 Tsarigradsko Chaussée Blvd., 1784 Sofia, Bulgaria
e-mail: ynikolov@nao-rozhen.org
2
CONICET-Universidad Nacional de Hurlingham, Av. Gdor. Vergara 2222, Villa Tesei, Buenos Aires, Argentina
3
Armagh Observatory and Planetarium, College Hill, BT61 9DG Armagh, Northern Ireland, UK
4
University of Maryland, Baltimore County, 620 W Lexington St., Baltimore, MD, USA
5
Columbia Astrophysics Lab, 550 W 120th St., New York, NY, USA
Received:
24
May
2023
Accepted:
22
September
2023
A long-standing question related to nova eruptions is how these eruptions might lead to dust formation, despite the ostensibly inhospitable environment for dust within the hot, irradiated ejecta. In the novae of systems such as the symbiotic binary RS Ophiuchi (RS Oph), ejecta from the white dwarf collide with pre-existing circumstellar material fed by the wind from the red-giant companion, offering a particularly clear view of some nova shocks and any associated dust production. In this work, we use the spectropolarimetric monitoring of the recurrent nova RS Oph starting two days after its eruption in August 2021 to show that: 1) dust was present in the RS Oph system as early as two days into the 2021 eruption; 2) the spatial distribution of this early dust was asymmetric, with components both aligned with and perpendicular to the orbital plane of the binary; 3) between two and nine days after the start of the eruption, this early dust was gradually destroyed; and 4) dust was again created, aligned roughly with the orbital plane of the binary more than 80 days after the start of the outburst, most likely as a result of shocks that arose as the ejecta interacted with circumbinary material concentrated in the orbital plane. The modeling of X-rays and very-high-energy (GeV and TeV) emission from RS Oph days to months into the 2021 eruption suggests that collisions between the ejecta and the circumbinary material may have led to shock formation in two distinct regions: the polar regions perpendicular to the orbital plane, where collimated outflows have been observed after prior eruptions, and a circumbinary torus in the orbital plane. The observations described here indicate that dust formed in approximately the same two regions, supporting the connection between shocks and dust in novae and revealing a very early onset of asymmetry. The spectropolarimetric signatures of RS Oph in the first week into the 2021 outburst indicate: 1) polarized flux across the Hα emission line and 2) the position angle orientation relative to the radio axis is similar to what is seen from the spectropolarimetric signatures of active galactic nuclei (AGNs).
Key words: binaries: symbiotic / techniques: polarimetric / stars: individual: RS Oph
© The Authors 2023
 Open Access article, published by EDP Sciences, under the terms of the Creative Commons Attribution License (https://creativecommons.org/licenses/by/4.0), which permits unrestricted use, distribution, and reproduction in any medium, provided the original work is properly cited.
This article is published in open access under the Subscribe to Open model. Subscribe to A&A to support open access publication.
1. Introduction
With its seven recorded outbursts, RS Oph is perhaps the best-studied recurrent nova. It belongs to a small group of objects, among which a white dwarf (WD) is accreting matter from the wind of its red giant companion and ultimately ignites under degenerate conditions with a sudden and major increase in luminosity when significant material has accumulated on its surface. The RS Oph binary system consists of a massive carbon-oxygen WD with MWD = 1.2–1.4 M⊙ (where MWD is the mass of the WD, e.g., Mikołajewska & Shara 2017) and a M2 III red giant (Zamanov et al. 2018) in a 453.6 day orbit with an inclination of i = 49°–52° (Brandi et al. 2009).
Detailed observations during the previous outburst allowed us to identify asymmetric structures on the expanding material (e.g., O’Brien et al. 2006; Bode et al. 2007; Ribeiro et al. 2009; Rupen et al. 2008; Sokoloski et al. 2008; Orlando et al. 2009; Montez et al. 2022) whose origin is still a matter of debate. Open questions remain regarding two main issues: 1) the asymmetries that are generated once the expanding ejecta interacts with the surrounding circumstellar material and 2) whether they are actually the direct result of radio jets anchored in the accretion disk.
After the 2006 outburst, infrared observations taken as early as 3.8 days after the start of the outburst indicated the presence of dust, mostly the silicate type, at about 17 AU from the WD, suggesting that this dust was already present before the outburst and survived the harsh environment during it (Barry et al. 2008). Later in the outburst, dust was detected on days 208 after the 2006 eruption by Evans et al. (2007). Derdzinski et al. (2017) conducted a theoretical study of the possibility that dust can be created behind radiative shocks during nova outbursts and concluded that under certain conditions, silicate-type dust can be created as early as one or two days into the outburst. This hypothesis can be tested during the 2021 outburst of RS Oph.
The most recent outburst of RS Oph, on 2021 August 8.93 UT, was first reported by K. Geary1. Hereafter, we adopt the time of eruption determined by Munari & Valisa (2021), namely, T0 = 2459435.00 JD. We present spectropolarimetric observations of the recurrent nova RS Oph from day 2 to day 352 after the start of the recent 2021 outburst, aimed at detecting variable intrinsic linear polarization and the presence of dust. In Sect. 2, we present the details of the observations and analysis. Section 3 highlights our results, followed by a discussion and the conclusions in Sects. 4 and 5, respectively.
2. Observations and data analysis
We obtained spectropolarimetric observations of RS Oph on eleven nights, with nine of them after the 2021 outburst and two observations taken 26 and 16 months before, during quiescence.
The spectropolarimetric observations were secured with the 2-Channel-Focal-Reducer Rozhen (FoReRo2)2, similar to that described by Jockers et al. (2000), attached to the Cassegrain focus of the 2.0 m RCC telescope of the Bulgarian Rozhen National Astronomical Observatory. A rotatable Super-Achromatic True Zero-Order Waveplate 53 retarder (APSAW-5) was added to FoReRo2. The observations consist of sets of eight polarized spectra. The resolving power is R ≈ 1100. A beam-swapping technique was used (Bagnulo et al. 2009) to minimize the instrumental polarization. The instrumental polarization was corrected using a standard star with zero degrees of polarization. The offset between the position angle in the celestial and instrumental polarization was corrected using strongly polarized standard stars.
For the spectral observations, we used two instruments: FoReRo2 for the low-resolution observations and the ESPERO spectrograph for the high-resolution observations. The ESPERO spectrograph is a fibre-fed Echelle spectrograph mounted on the 2 m telescope at Rozhen NAO (Bonev et al. 2017). It has a resolution of ∼30 000 and covers the range 3900 Å–9000 Å.
The journal of observations is given in Table 1. The table contains the date (in format YYYY-MM-DD), UT, of the beginning of the observation, the number of days after the start of the 2021 outburst (the “–” sign indicates the days before the outburst) and the total exposure time.
Journal of observations.
3. Results
3.1. Spectral evolution
In Fig. 1, we present the spectral evolution of RS Oph in the period August-October 2021 based on the low-resolution data. The most prominent feature on the spectra is the Hα emission line. After the outburst, the equivalent width of the Hα line is increased, reaching ∼−3000 Å on 2021 Sept., followed by a decrease. The complex structure of the line is not well defined due to the low resolution of the spectra. On 2021 Aug. 10 (i.e., two days after the outburst, a P Cyg profile with velocity up to ∼−4260 km s−1 has been detected. The measured velocity is in agreement with the value, reported by Mikolajewska et al. (2021).
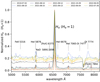 |
Fig. 1. Spectral evolution of RS Oph after the 2021 outburst. For comparison, we also include a spectrum taken in quiescence, on July 2019. The most prominent lines are highlighted. |
The HeI emission lines at 5876 Å, 6678 Å, and 7065 Å evolve rapidly after the outburst, becoming prominent on the spectra after two days. The OI lines at 7477 Å and 7773 Å (respectively) are well-defined, especially on the spectrum obtained on 2021 Aug. 10. The most prominent Fe feature in the spectra is the FeII multiplet at 5316 Å, being more evident on the earliest spectrum. In addition, some coronal lines of [FeX] and [FeXI] at 6375 Å and 7892 Å respectively are visible on the later spectra, when RS Oph entered a supersoft source phase (Page 2021; Munari et al. 2021).
In Fig. 2, we present the spectral evolution of selected emission lines in the spectra of RS Oph based on high-resolution data. The observations were obtained on 2021 September 17 (40 days after the outburst) and on 2022 May 20 (285 days after the outburst). For comparison, we present also a spectrum obtained before the outburst, on 2019 July 17. The Balmer Hβ emission line observed on 2021 September 17 is complex, revealing a structure similar to that observed in Hα line (Zamanov et al. 2022). A sharp P Cyg profile is visible at the top of a strong and broad emission.
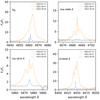 |
Fig. 2. Selected high-resolution emission lines in the spectra in quiescence (2019) and 40 and 285 days after the outburst. The line profiles are very complex, with at least three components at different radial velocities. |
The triple-peaked He I line has radial velocities of −235 km s−1, −30 km s−1 and 130 km s−1. The radial velocities of the peaks of the OI 8446 Å line are −190 km s−1, −25 km s−1, and 137 km s−1. The He II lines are produced by shocked ejected material during its cooling phase, so the presence of the He II 4686 Å line 40 days after the outburst confirms the shock wave (Azzollini et al. 2023).
The spectral observations reveal a typical spectral behavior of a nova with a complex structure dominated by broad Balmer, He, O, and Fe lines (with some of them showing P Cyg profiles) evolving towards a supersoft source phase.
3.2. Interstellar polarization toward the Recurrent Nova RS Oph
The observed polarization is a vectorial sum of intrinsic polarization and interstellar polarization. The recurrent nova phenomenon gives us the opportunity to study an object before and after the nova outburst. A 3D map of the interstellar polarization in the field around RS Oph is presented in Fig. 3. The data are taken from Heiles (2000), Cropper (1990) and Nikolov et al. (2019). The observed degree of polarization and position angle of RS Oph during quiescence is similar to the degree of polarization and position angle of the stars of the vicinity of RS Oph published by Cropper (1990). Moreover, the spectropolarimetric observations during quiescence do not show the characteristics of an object with an intrinsic polarization, such as a depolarization effect across the Hα emission line, a variable degree of polarization and a variable position angle (Nikolov et al. 2019).
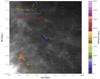 |
Fig. 3. Interstellar polarization of the field stars around RS Oph (Heiles 2000; Cropper 1990). The degree of polarization is proportional to the length of the orange straight lines. The horizontal bar at the top left presents 4.0% polarization. The PA of the stars in the direction of RS Oph (with blue bar) is similar to that of RS Oph during quiescence (red line; Nikolov et al. 2019). The color of every star corresponds to its distance. The background image represents 100 μm dust emission maps (Schlegel et al. 1998). |
In Fig. 4, we show the observed degree of polarization and position angle of RS Oph taken 26 and 16 months before the 2021 outburst and during quiescence, as well as the position angle and degree of polarization of 2MASS 17500625-0643499, a nearby source at an angular distance of ≈2.2 arcmin. The wavelength dependence of the observed degree of polarization of 2MASS 17500625-0643499 is the same as the wavelength dependence of RS Oph during quiescence at the same position angle. The observations of RS Oph during quiescence thus indicate that the observed pre-eruption polarization is interstellar, as no intrinsic polarization was detected (Nikolov et al. 2019; Somero et al. 2017).
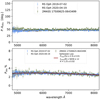 |
Fig. 4. Observed position angle (top) and degree of polarization (bottom) of RS Oph and 2MASS 17500625-0643499. The red curve represents fit with Serkowski’s law (Serkowski et al. 1975). |
One of the methods to separate intrinsic and interstellar polarization is based on the depolarization effect of the emission lines. Using this method, Kawabata et al. (2006) determined the intrinsic polarization of Nova V475 Scuti, in which a clear depolarization effect was well visible on day 25 after the outburst. Our observations demonstrate that in the case of RS Oph, this method is applicable shortly after the outburst when the scattering region is relatively smaller than the emission line region and the degree of polarization in the Hα emission line is approximately 0. The He I 5876 and Hα lines have different degrees of polarization in the core of their profiles. Using them for the determination of the interstellar polarization would give a different (smaller) power law index. This method gives accurate results when the scattering region is much smaller than the emission-line region. In the case of RS Oph, the scattering region gradually expanded into the emission-line region, and the depolarization effect decreased over time.
3.3. Intrinsic polarization of RS Oph after 2021 outburst
To calculate the Stokes parameters of the intrinsic polarization Qint(λ) and Uint(λ) of RS Oph, we derived these values from our observations and corrected them for the interstellar polarization using the equations:


where Qobs(λ) and Uobs(λ) are the Stokes parameters of the observed polarization after the 2021 outburst. QIS(λ) and UIS(λ) represent the Stokes parameters of the interstellar polarization. As interstellar Stokes parameters, we used the parameters QIS(λ) and UIS(λ) obtained on 2019 July 2. The degree of intrinsic polarization (Pint(λ)) and intrinsic position angle (θint(λ)) were calculated using the following equations:
where Θ0 depends on the sign of Qint(λ) and Uint(λ) (Bagnulo et al. 2009).
In Fig. 5, we present the normalized intensity (normalized Stokes I) parameter and the degree of intrinsic polarization as a function of wavelength for each of the spectra taken during our campaign. The polarization spectra on days 34.8 (2021 September 12) and 35.8 (2021 September 13) are noisy because of the low continuum signal. The spectra obtained on days 34.8, 35.8, and 81.8 after the 2021 outburst are thus binned with a dispersion of 20 Å/pix. The maximum degree of intrinsic polarization, of about 1%, is observed on day 5.9.
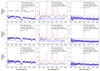 |
Fig. 5. Intrinsic polarization of RS Oph after the 2021 outburst. The degree of polarization is presented in blue. Strong depolarization effects are well visible in the first week after the start of the 2021 outburst (left column). The normalized intensity is presented in red. The orange line represents the power law fit of the degree of polarization data. The index of the power law increases in the first week after the start of the 2021 outburst (left column). Subsequently, from day 300 to day 352, the power law index decreases (right column). |
Strong depolarization effects are observed in FeII 5169 Å, HeI 5876 Å, Hα, HeI 6678 Å, HeI 7065 Å, and OI 7771 Å emission lines until 6.7 days after the outburst. The small polarization of the Hα and HeI 5876 Å emission lines on days 2, 5.9, and 6.7 is noticeable. The polarization in the Hα emission line is approximately 0.05% on day 2 and 0.3% on days 5.9 and 6.7. The HeI 5876 Å emission line polarization is approximately 0.35% on day 2 and 0.5%–0.4% on days 5.9 and 6.7, respectively. The typical error on the degree of polarization in the emission lines is 0.05%. The depolarization in the emission lines suggests that the scattering material is located within the emission line region. On the other hand, the polarization in the HeI 5876 Å emission line is higher than the Hα emission line. This is because the Hα region is more extended than HeI 5876 Å region. It is worth noting that the depolarization effect decreased with time. This can be explained by the scattering region expanding into the emission-line region.
Figure 6 shows the position angle of the intrinsic polarization as a function of wavelength from the observations taken after the 2021 outburst (days 2, 5.9, 6.7, 81.8, and 352). We omit the data from days 34.8, 35.8, 300, and 301 due to their low signal-to-noise ratios (S/Ns). The data presented in Fig. 6 were smoothed using a moving average of over seven points to better illustrate the position angle structures across the Hα emission line. The position angle of the intrinsic polarization is approximately 90° throughout the wavelength range explored, with the exception of the region around Hα on day 2, which shows a position angle of 180° (see discussion in Sect. 3.3.3). The 90° position angle, which implies a scattering structure that extends predominantly in the N–S direction on the sky, is aligned with the highly collimated outflows detected during the outbursts in 2006 (e.g., Rupen et al. 2008) and 2021 (Munari et al. 2022).
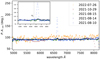 |
Fig. 6. Intrinsic position angle of RS Oph after the 2021 outburst. Aside from the 180° position angle around the Hα region on day 2, the position angle of the intrinsic polarization is, on average, 90°. This implies that the scattering region that produced the observed polarization was oriented perpendicular to the elongated structures observed at other wavelengths during the last two outbursts. The data were smoothed with a moving average over seven points to better illustrate the position angle structures. |
3.3.1. Wavelength dependence of the intrinsic polarization
The degree of intrinsic polarization after the 2021 outburst increases toward shorter wavelengths. We use a monotonic function (power-law) as a description of the variation of the degree of intrinsic polarization with the wavelength. We fit the continuum data with a power law as:

where c is a scaling constant and β is a power law index. This index indicates the nature of the scattering process: i) Mie scattering by dust grains or ii) Thompson scattering by electrons. The first process is wavelength-dependent, whereas Thompson scattering is not. Figure 7 shows the power-law index as a function of time after the outburst. The index increases from β = −2.2 on day 2 and reaches β = 0, which corresponds to Thompson scattering, on day 9. After that, the index decreased again until day 352, reaching values of β = −1.6.
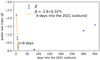 |
Fig. 7. Long-term variability of the index of the power law fit, β, of the polarization degree dependence with wavelength. |
3.3.2. Long-term variability of the degree of intrinsic polarization and position angle in the broadband
We used the IRAF SBAND procedure to calculate broadband linear polarization. Two sets of bands were chosen: a standard V band and filter C. We selected a region with a weak depolarization effect in the wavelength range between λ1 = 5200 Å and λ2 = 5600 Å to define filter C. The transmission function of the C filter is 100%.
The long-term variability of the degree of intrinsic polarization and position angle are presented in Fig. 8. Pint(V) and Pint(C) represent the degree of intrinsic polarization in the V band and in the C band, respectively. The intrinsic polarization increased from day 2 to day 5.9 after the outburst. After day 5.9, the degree of intrinsic polarization decreased and we obtained Pint(V) = 0.34%±0.05% and Pint(C) = 0.37%±0.05% on day 352 after the outburst. On day 5.9, we detected the highest degree of intrinsic polarization, with Pint(V) = 1.2%±0.05% and Pint(C) = 1.39%±0.05%. The position angle of the intrinsic polarization (PAint(V) and PAint(C)) was practically constant during the observations and had a value of approximately 90°.
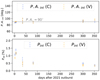 |
Fig. 8. Long-term variability of the position angle (top) and degree of intrinsic polarization (bottom) of RS Oph after the start of the 2021 outburst. The PA was practically constant throughout our observing campaign, while the degree of intrinsic polarization reached a maximum at day 5.9 and has been decreasing since then. |
3.3.3. Evolution of the polarized flux
In Fig. 9, we present the position angle, the evolution of the polarized flux, and the degree of the intrinsic polarization during the first week of the outburst. The position angle (PA) of the intrinsic polarization on the second day into the outburst (left column, top) shows a complex structure, with PA ≈ 90° at wavelengths between λ = 6200 Å and λ = 6600 Å and PA ≈ 180° for wavelengths between λ = 6600 Å and λ = 6650 Å. Radio interferometric imaging of RS Oph obtained 34 days after the start of the 2021 nova outburst shows a bipolar structure (Munari et al. 2022) in the east-west direction; the orbital plane is perpendicular to these radio lobes. When the PA was 90°, it was thus aligned with the observed bipolar structure. When the PA was 180°, it was aligned with the orbital plane. The wavelength range with PA = 180° corresponds to the small peak in the polarized flux spectrum near a velocity of v = 3000 km s−1 (see the left column in Fig. 9). The two main observed values of the position angle correspond to the mutually perpendicular planes.
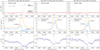 |
Fig. 9. Evolution of the polarized flux across the Hα emission line. The position angles (PA) are presented in red in the first row from day 2 (left) to day 6.7 (right) into the 2021 outburst. The PA on the 2nd day into the outburst (left column, top) shows a complex structure. The evolution of the polarized flux (in blue) and 0.01*flux (in orange) are presented in the second row. Asymmetries in the blue- and red-shifted peaks of the polarized flux are well visible. In the third row, the degree of polarization is presented. |
4. Discussion
4.1. Quick dust formation after the outburst
Our observations show the presence of dust as early as two days after the outburst. The wavelength dependence of the intrinsic polarization gives information about the nature of the scattering process. If the scattering is dominated by dust, we expect an increase in the intrinsic polarization toward shorter wavelengths. By modeling the continuum of the polarized spectra, we found that it was strongly wavelength-dependent from day 2 until day 9 after the outburst. This finding provides the most direct observational support of the presence of dust in a nova at such early times.
Although other novae have shown optical polarization within a few days of the start of the eruption, the case for early dust associated with the nova has been less definitive. As early as 1.36 days after the outburst of T Pyx, Pavana et al. (2019) detected polarization that could be attributed to asymmetries during the outburst or the presence of silicate dust that survived the eruption; however, given the unknown amount of interstellar polarization toward T Pyx, it was not possible for those authors to determine the wavelength dependence of the intrinsic polarization and how the intrinsic polarization and position angle varied with time, precluding a definitive conclusion on its origins to be drawn. Kawabata et al. (2000) observed Nova V4444 Sgr from days 2 to 10 after the start of its 1999 outburst and found a wavelength-dependent intrinsic polarization with a power law index in the range: −2 ≲ β ≲ −1. Given that this dependence did not change with time, however, the authors concluded that the most likely origin was scattering by pre-existing dust located at several dozen AU from the central star. Nova V1494 Aql was observed between days 2.39 and 3.39 after the start of its outburst by Kawabata et al. (2001). In their Fig. 4, the visual negative slope of the degree of intrinsic polarization with the wavelength increases from day 2.39 to day 3.39 and decreases since then.
Evidence for dust formation in novae has been found through observations in the IR and optical at a much later phase of the outburst. Infrared observations of RS Oph with the Spitzer telescope from 208 to 430 days after the start of the 2006 eruption of RS Oph revealed the presence of silicate dust in the environs of the system (see Evans et al. 2007; Woodward et al. 2008). Evans et al. (2002) found that the wavelength-dependence of polarization in the case of V4362 Sgr suggests scattering by small dust grains (80 days after the start of the outburst). In the case of V339 Del, Kawakita et al. (2019) used the continuum from the neighboring emission-free regions as values for the interstellar polarization. Nova V339 Del produced dust grains around 35 days into the outburst (Evans et al. 2017).
Our detection of wavelength-dependent intrinsic polarization indicates that, most likely, dust particles were created in dense regions shielded from the strong radiation field of the eruption. Such wavelength-dependent polarization was not observed during quiescence (down to our detection error of 0.05%), which strongly suggests that dust was not present during the quiescence phase. Moreover, Cropper (1990) found that the observed polarization of RS Oph a year after the start of the 1985 outburst was comparable with the polarization of nearby stars.
The possibility that dust can be created in radiative shock regions was studied by Derdzinski et al. (2017), who concluded that dust can be formed in, dense, shielded shock regions. These dense shocks, however, have been modeled by Metzger et al. (2014, 2015) in the context of novae in CVs; similar studies tailored for embedded nova such as RS Oph are necessary to establish if dense regions behind shocks in those systems are also expected to be conducive to dust formation. Our data show that dust was present between days 2 and 9, and at about this same time, the γ-ray emission detected by Fermi peaked (Cheung et al. 2022). The GeV-TeV emission has been modeled as due to multiple shocks, with the “slow” component first expanding into a high-density environment (Diesing et al. 2023). Our finding thus provides strong observational support that the scenario proposed by Derdzinski et al. (2017) is plausible for embedded novae as well as classical novae (see, e.g., Chomiuk et al. 2021; Babul et al. 2022, for a discussion of dust formation in classical novae).
The changes in the wavelength dependence of the intrinsic polarization with time, parameterized by the power law index, β, indicate that the process of scattering switched from a mix of dust with different-sized grains to Thompson scattering after day 9. This switch indicates that any dust that was formed within the first week or so of the eruption quickly evaporated. Conditions then became favorable for dust formation again much later in the outburst. In their infrared observation on day 12 after the 2021 outburst, Woodward et al. (2021) did not find any evidence of dust. The spectropolarimetric observations on days 300 and 352 after the outburst do show the presence of dust grains. Further infrared observations can confirm the presence of dust months to years after the 2021 outburst.
4.2. Early development of asymmetries in the ejecta
After the previous outburst in 2006, observations at a variety of wavelengths revealed evidence of the presence of asymmetric structures aligned preferentially in the east-west (E–W) direction. Chesneau et al. (2007) found a structure moving rapidly in the E–W direction 5.5 days into the outburst. Bode et al. (2007) and Ribeiro et al. (2009) found also E–W extended emission in the HST images taken 155 and 449 days after the start of the 2006 outburst. Radio observations reported by O’Brien et al. (2006) two weeks into the outburst, Rupen et al. (2008) 20.8 and 26.8 days into the outburst, and Sokoloski et al. (2008) 5 and 8 weeks into the outburst, reported extended emission in the E–W direction as well. The X-ray observations reported by Montez et al. (2022) also show evidence of E–W asymmetries 1254 and 1927 days after the start of the outburst. Radio interferometric imaging of RS Oph 34 days into the 2021 outburst shows a bipolar structure with two components: east arc (EA) and west lobe (WL), expanding perpendicular to the orbital plane in opposite directions (Munari et al. 2022). All observations of asymmetry indicate a bipolar structure with a dominant E–W orientation.
Our detection of linear polarization on day 2 constitutes the earliest evidence of an asymmetric structure in RS Oph reported to date. With a position angle of 90° aligned with the previously known E–W structures, our finding indicates that some structure was present in the equatorial plane before day 2, consistent with the scenario in which the ejecta is shaped after its interaction with an equatorial density enhancement (Munari et al. 2022). From the orientation of the radio lobes, which are perpendicular to the orbital plane, we can conclude that PA = 90° corresponds to the scattering of light by material in the orbital plane. On the other hand, PA = 180° corresponds to the scattering of light by material in the polar regions.
The polarized flux represents the spectrum of the scattered light. We observed a noticeable asymmetry of the polarized flux on day 2 – a strong blue-shifted peak with a radial velocity of vr ≈ −1200 km s−1 at a position angle PA ≈ 90° and a small red-shifted peak with a radial velocity of vr ≈ +3000 km s−1 at a position angle PA ≈ 180° (Fig. 9). The interaction between the ejecta and an equatorial density enhancement is responsible for the formation of a ring-like structure in the orbital plane (see Munari et al. 2022). As depicted in Fig. 10, the west lobe is moving toward us and the portion of the torus that is moving away from us (red-shifted) is hidden by the west lobe. The material within the west lobe absorbs the scattered light from the red-shifted part of the torus. This half-torus structure is similar to the structure observed in radio wavelengths by O’Brien et al. (2006) after the 2006 outburst. It is possible to separate the equatorial from the polar scattering regions only in the case when the red-shifted component of the equatorial torus is hidden. Such asymmetry of the polarized flux and position angle is not observed during the next observations between days 5.9 and 6.7. The PA on days 5.9 and 6.7 shows that matter in the orbital plane is now responsible for the scattering. Further proof of the torus-like structure in the orbital plane is a triple-peaked profile of the permitted lines (Munari et al. 2022). The velocities of the double peak of the polarized flux across the Hα emission line are highlighted in Fig. 9 and represent the radial velocities of the slowly expanding torus. Our values of the radial velocities of the torus and the east arc are consistent with the observations, presented by Chesneau et al. (2007) 5.5 days after the 2006 eruption. Chesneau et al. (2007) identifified a slowly moving equatorial ring (vr ≤ 1800 km s−1) and a faster moving E–W bipolar ejecta (vr ∼ 2500 − 3000 km s−1).
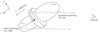 |
Fig. 10. Schematic view of the polar and equatorial scattering regions that are detected at different position angles and their contribution to the polarized flux. |
Similar torus-like structures have been observed in classical novae, but in this case, they are thought to arise from the propeller effect of the orbital motion on the ejecta (Chomiuk et al. 2014). Given the long orbital periods of symbiotic recurrent novae, it is not entirely clear whether this effect might be at work or whether the torus-like structure had been present in the system before the outburst.
4.3. Different types of objects – similar spectropolarimetric signatures
The similar spectropolarimetric signatures between RS Oph and active galactic nuclei (AGNs) relate to the following characteristics: 1) a polarized flux structure across the Hα emission line and 2) position angle orientation relative to the radio axis.
Three-quarters of AGNs with detected intrinsic polarization presented by Smith et al. (2002) exhibit a decrease in the degree of polarization across the core of the Hα emission line. In two of them, Mrk 6 and Mrk 335, the red-shifted peak of the polarized flux is higher than the blue-shifted peak, similarly to the polarized flux in RS Oph observed on day 5.9 and day 6.9 into the 2021 outburst (Fig. 9). In the case of RS Oph, the depolarization in the emission lines is due to the scattering material being located within the emission line region. A similar explanation was suggested by Cohen et al. (1999). Those authors observed weakly polarized narrow lines in a sample of 13 FR II radio galaxies. The narrow lines arise outside of the scattering region and the net effect is a decrease of the degree of polarization in the core of the emission lines. A more complex explanation of the decrease in the degree of polarization for AGNs has been proposed by Smith et al. (2002), where the broad-line region takes the form of a rotating disc surrounded by a co-planar ring of scatterers – this geometry will produce a high degree of polarization in the wings of the Hα emission line (see Smith et al. 2002, Sect. 4.3). A similar explanation may also be valid for RS Oph if the accretion disc survives the outburst and lies in the same plane as the scattering region.
A position angle parallel to the radio axis (with PA = 90° in the case of RS Oph) is similar to that observed in type 1 Seyfert galaxies, where the optical polarization PA is often parallel to the radio axis (Smith et al. 2004), whereas PA = 180° is most similar to type 2 Seyfert galaxies, in which the optical polarization position angle is perpendicular to the projected radio source axis (e.g., Antonucci 1983; Brindle et al. 1990). Scattering in a plane perpendicular to the radio axis produces a position angle parallel to the radio axis. On the other hand, scattering in a plane aligned with the radio axis would produce a position angle perpendicular to the radio axis (Smith et al. 2002). We suggest that similar geometry, torus, and polar scattering regions can reproduce similar spectropolarimetric signatures.
Theoretical results based on hydrodynamical simulations for classical novae predict that much of the outflowing mass is focused into the equatorial plane and forms spiral arms (Shen & Quataert 2022). Moreover, 3D hydrodynamical simulations of RS Oph in the quiescent phase show that the circumstellar mass distribution is highly structured with a mass enhancement in the orbital plane (Walder et al. 2008; Booth et al. 2016). For RS Oph, the interaction between the nova ejecta with the accretion disc and focused mass in the orbital plane forms an equatorial ring-like structure and limits the ejecta within a bipolar direction perpendicular to the orbital plane (Booth et al. 2016).
For those novae that form an equatorial-like structure (or torus) during the outburst, the scattering geometry limits the orientation of the position angle, making it parallel or perpendicular to the torus depending on the relative contribution of the equatorial and polar scattering region.
5. Conclusions
The optical linear spectropolarimetric observations in the range from 5000 Å to 8200 Å of the recurrent nova RS Oph after the 2021 outburst indicate that:
-
The variable degree of intrinsic polarization in RS Oph with time and wavelength suggests the presence of dust as early as day 2. This dust could have been created in the strongly shielded, dense shock regions (Evans et al. 2007).
-
The continuum intrinsic polarization can be fitted with a power law. The power law index β increased from β = −2.2 on day 2 to β = 0 on day 9. The flat polarization continuum suggests that dust was destroyed, and the scattering was then due to Thompson electron scattering. In the last three observations, after day 300 into the 2021 outburst, the power index β decreases to β = −1.6. This is an indicator of dust formation and the position angle PA = 90° means that the dust is located in the orbital plane.
-
The polarized light two days after the outburst shows two position angles at 90° and 180° degrees. The position angle PAint ≈ 90° is aligned with the radio/optical/X-rays elongated structures detected at much later times after the 2006 outburst. The result of PAint ≈ 180° degrees indicates that during these early times, there is a region responsible for the light scattering that is perpendicular to the ejecta in the polar directions. These details provide the first evidence of the development of asymmetries in the ejecta.
-
We suggest that a similar geometry (in terms of the torus and polar scattering region) present in AGNs and RS Oph may reproduce similar spectropolarimetric signatures.
Our observations indicate that dust is formed in two distinct regions: the polar regions perpendicular to the orbital plane and a circumbinary density enhancement in the orbital plane. Interestingly, the modeling of GeV and TeV emission from RS Oph days to months after the 2021 eruption by Diesing et al. (2023) suggests that the expansion of the ejecta into the circumbinary material may have led to the formation of shocks in the same two regions. Both results support the connection between shocks and dust in novae. Future spectropolarimetric observations of other novae will be an essential analytical tool for investigating dust formation as well as the early evolution of the asymmetry characterizing the ejected material.
Acknowledgments
Y.N. acknowledges partial support by grants: KΠ-06-M58/1 “Spectral and spectropolarimetric characteristics of the interstellar medium” and KΠ-06-H28/2 “Binary stars with compact object” by the Bulgarian National Science Fund. K.S. acknowledges support by the Bulgarian National Science Fund – project KP-06-Russia/2-2020, “An investigation of binary systems with a compact object using Doppler tomography”. A.A.-B. acknowledges support by the Bulgarian National Science Fund – project KΠ-06-H58/3 “Environments of exoplanets: the role of coronal mass ejections and superflares”. G.J.M.L. is a member of the CIC-CONICET (Argentina) and acknowledges support from grant ANPCYT-PICT 0901/2017. J.L.S. acknowledges support from US NSF award AST-1816100. The authors would like to thank Valeri Golev, Radoslav Zamanov, Luba Slavcheva-Mihova, Boyko Mihov, and Claudia Vilega Rodrigues for the fruitful discussion, comments, and support.
References
- Antonucci, R. R. J. 1983, Nature, 303, 158 [NASA ADS] [CrossRef] [Google Scholar]
- Azzollini, A., Shore, S. N., Kuin, P., et al. 2023, A&A, 674, A139 [NASA ADS] [CrossRef] [EDP Sciences] [Google Scholar]
- Babul, A., Sokoloski, J. L., Chomiuk, L., et al. 2022, MNRAS, 515, 3028 [NASA ADS] [CrossRef] [Google Scholar]
- Bagnulo, S., Landolfi, M., Landstreet, J. D., et al. 2009, PASP, 121, 993 [Google Scholar]
- Barry, R. K., Danchi, W. C., Traub, W. A., et al. 2008, ApJ, 677, 1253 [NASA ADS] [CrossRef] [Google Scholar]
- Brandi, E., Quiroga, C., Mikołajewska, J., et al. 2009, A&A, 497, 815 [NASA ADS] [CrossRef] [EDP Sciences] [Google Scholar]
- Brindle, C., Hough, J. H., Bailey, J. A., et al. 1990, MNRAS, 244, 577 [NASA ADS] [Google Scholar]
- Bode, M. F., Harman, D. J., O’Brien, T. J., et al. 2007, ApJ, 665, L63 [NASA ADS] [CrossRef] [Google Scholar]
- Bonev, T., Markov, H., Tomov, T., et al. 2017, Bulg. Astron. J., 26, 67 [Google Scholar]
- Booth, R. A., Mohamed, S., & Podsiadlowski, P. 2016, MNRAS, 457, 822 [NASA ADS] [CrossRef] [Google Scholar]
- Chesneau, O., Nardetto, N., Millour, F., et al. 2007, A&A, 464, 119 [NASA ADS] [CrossRef] [EDP Sciences] [Google Scholar]
- Cheung, C. C., Johnson, T. J., Jean, P., et al. 2022, ApJ, 935, 44 [NASA ADS] [CrossRef] [Google Scholar]
- Chomiuk, L., Linford, J. D., Yang, J., et al. 2014, Nature, 514, 339 [NASA ADS] [CrossRef] [Google Scholar]
- Chomiuk, L., Linford, J. D., Aydi, E., et al. 2021, ApJS, 257, 49 [NASA ADS] [CrossRef] [Google Scholar]
- Cohen, M. H., Ogle, P. M., Tran, H. D., et al. 1999, AJ, 118, 1963 [NASA ADS] [CrossRef] [Google Scholar]
- Cropper, M. 1990, MNRAS, 243, 144 [NASA ADS] [CrossRef] [Google Scholar]
- Derdzinski, A. M., Metzger, B. D., & Lazzati, D. 2017, MNRAS, 469, 1314 [NASA ADS] [CrossRef] [Google Scholar]
- Diesing, R., Metzger, B. D., Aydi, E., et al. 2023, ApJ, 947, 70 [NASA ADS] [CrossRef] [Google Scholar]
- Evans, A., Yudin, R. V., Naylor, T., et al. 2002, A&A, 384, 504 [NASA ADS] [CrossRef] [EDP Sciences] [Google Scholar]
- Evans, A., Woodward, C. E., Helton, L. A., et al. 2007, ApJ, 671, L157 [NASA ADS] [CrossRef] [Google Scholar]
- Evans, A., Banerjee, D. P. K., Gehrz, R. D., et al. 2017, MNRAS, 466, 4221 [NASA ADS] [Google Scholar]
- Heiles, C. 2000, AJ, 119, 923 [Google Scholar]
- Jockers, K., Credner, T., Bonev, T., et al. 2000, Kinematika i Fizika Nebesnykh Tel Supplement, 3, 13 [NASA ADS] [Google Scholar]
- Kawabata, K. S., Hirata, R., Ikeda, Y., et al. 2000, ApJ, 540, 429 [NASA ADS] [CrossRef] [Google Scholar]
- Kawabata, K. S., Akitaya, H., Hirakata, N., et al. 2001, ApJ, 552, 782 [NASA ADS] [CrossRef] [Google Scholar]
- Kawabata, K. S., Ohyama, Y., Ebizuka, N., et al. 2006, AJ, 132, 433 [NASA ADS] [CrossRef] [Google Scholar]
- Kawakita, H., Shinnaka, Y., Arai, A., et al. 2019, ApJ, 872, 120 [NASA ADS] [CrossRef] [Google Scholar]
- Metzger, B. D., Hascoët, R., Vurm, I., et al. 2014, MNRAS, 442, 713 [NASA ADS] [CrossRef] [Google Scholar]
- Metzger, B. D., Finzell, T., Vurm, I., et al. 2015, MNRAS, 450, 2739 [Google Scholar]
- Mikołajewska, J., & Shara, M. M. 2017, ApJ, 847, 99 [CrossRef] [Google Scholar]
- Mikolajewska, J., Aydi, E., Buckley, D., et al. 2021, ATel, 14852 [Google Scholar]
- Montez, R., Luna, G. J. M., Mukai, K., et al. 2022, ApJ, 926, 100 [NASA ADS] [CrossRef] [Google Scholar]
- Munari, U., & Valisa, P. 2021, arXiv e-prints [arXiv:2109.01101] [Google Scholar]
- Munari, U., Valisa, P., & Ochner, P. 2021, ATel, 14895 [Google Scholar]
- Munari, U., Giroletti, M., Marcote, B., et al. 2022, A&A, 666, L6 [NASA ADS] [CrossRef] [EDP Sciences] [Google Scholar]
- Nikolov, Y. M., Zamanov, R. K., & Stoyanov, K. A. 2019, Acta Astron., 69, 361 [NASA ADS] [Google Scholar]
- O’Brien, T. J., Bode, M. F., Porcas, R. W., et al. 2006, Nature, 442, 279 [CrossRef] [Google Scholar]
- Page, K. L. 2021, ATel, 14894 [Google Scholar]
- Pavana, M., Anche, R. M., Anupama, G. C., et al. 2019, A&A, 622, A126 [NASA ADS] [CrossRef] [EDP Sciences] [Google Scholar]
- Orlando, S., Drake, J. J., & Laming, J. M. 2009, Protostellar Jets in Context, 13, 373 [NASA ADS] [CrossRef] [Google Scholar]
- Ribeiro, V. A. R. M., Bode, M. F., Darnley, M. J., et al. 2009, ApJ, 703, 1955 [NASA ADS] [CrossRef] [Google Scholar]
- Rupen, M. P., Mioduszewski, A. J., & Sokoloski, J. L. 2008, ApJ, 688, 559 [NASA ADS] [CrossRef] [Google Scholar]
- Schlegel, D. J., Finkbeiner, D. P., & Davis, M. 1998, ApJ, 500, 525 [Google Scholar]
- Serkowski, K., Mathewson, D. S., & Ford, V. L. 1975, ApJ, 196, 261 [NASA ADS] [CrossRef] [Google Scholar]
- Shen, K. J., & Quataert, E. 2022, ApJ, 938, 31 [NASA ADS] [CrossRef] [Google Scholar]
- Smith, J. E., Young, S., Robinson, A., et al. 2002, MNRAS, 335, 773 [NASA ADS] [CrossRef] [Google Scholar]
- Smith, J. E., Robinson, A., Alexander, D. M., et al. 2004, MNRAS, 350, 140 [Google Scholar]
- Sokoloski, J. L., Rupen, M. P., & Mioduszewski, A. J. 2008, ApJ, 685, L137 [NASA ADS] [CrossRef] [Google Scholar]
- Somero, A., Hakala, P., & Wynn, G. A. 2017, MNRAS, 464, 2784 [NASA ADS] [CrossRef] [Google Scholar]
- Walder, R., Folini, D., & Shore, S. N. 2008, A&A, 484, L9 [NASA ADS] [CrossRef] [EDP Sciences] [Google Scholar]
- Woodward, C. E., Helton, L. A., Evans, A., et al. 2008, ASP Conf. Ser., 401, 260 [NASA ADS] [Google Scholar]
- Woodward, C. E., Evans, A., Banerjee, D. P. K., et al. 2021, ATel, 14866 [Google Scholar]
- Zamanov, R. K., Boeva, S., Latev, G. Y., et al. 2018, MNRAS, 480, 1363 [NASA ADS] [CrossRef] [Google Scholar]
- Zamanov, R. K., Stoyanov, K. A., Nikolov, Y. M., et al. 2022, Bulg. Astron. J., 37, 24 [NASA ADS] [Google Scholar]
All Tables
All Figures
|
Fig. 1. Spectral evolution of RS Oph after the 2021 outburst. For comparison, we also include a spectrum taken in quiescence, on July 2019. The most prominent lines are highlighted. |
| In the text | |
|
Fig. 2. Selected high-resolution emission lines in the spectra in quiescence (2019) and 40 and 285 days after the outburst. The line profiles are very complex, with at least three components at different radial velocities. |
| In the text | |
|
Fig. 3. Interstellar polarization of the field stars around RS Oph (Heiles 2000; Cropper 1990). The degree of polarization is proportional to the length of the orange straight lines. The horizontal bar at the top left presents 4.0% polarization. The PA of the stars in the direction of RS Oph (with blue bar) is similar to that of RS Oph during quiescence (red line; Nikolov et al. 2019). The color of every star corresponds to its distance. The background image represents 100 μm dust emission maps (Schlegel et al. 1998). |
| In the text | |
|
Fig. 4. Observed position angle (top) and degree of polarization (bottom) of RS Oph and 2MASS 17500625-0643499. The red curve represents fit with Serkowski’s law (Serkowski et al. 1975). |
| In the text | |
|
Fig. 5. Intrinsic polarization of RS Oph after the 2021 outburst. The degree of polarization is presented in blue. Strong depolarization effects are well visible in the first week after the start of the 2021 outburst (left column). The normalized intensity is presented in red. The orange line represents the power law fit of the degree of polarization data. The index of the power law increases in the first week after the start of the 2021 outburst (left column). Subsequently, from day 300 to day 352, the power law index decreases (right column). |
| In the text | |
|
Fig. 6. Intrinsic position angle of RS Oph after the 2021 outburst. Aside from the 180° position angle around the Hα region on day 2, the position angle of the intrinsic polarization is, on average, 90°. This implies that the scattering region that produced the observed polarization was oriented perpendicular to the elongated structures observed at other wavelengths during the last two outbursts. The data were smoothed with a moving average over seven points to better illustrate the position angle structures. |
| In the text | |
|
Fig. 7. Long-term variability of the index of the power law fit, β, of the polarization degree dependence with wavelength. |
| In the text | |
|
Fig. 8. Long-term variability of the position angle (top) and degree of intrinsic polarization (bottom) of RS Oph after the start of the 2021 outburst. The PA was practically constant throughout our observing campaign, while the degree of intrinsic polarization reached a maximum at day 5.9 and has been decreasing since then. |
| In the text | |
|
Fig. 9. Evolution of the polarized flux across the Hα emission line. The position angles (PA) are presented in red in the first row from day 2 (left) to day 6.7 (right) into the 2021 outburst. The PA on the 2nd day into the outburst (left column, top) shows a complex structure. The evolution of the polarized flux (in blue) and 0.01*flux (in orange) are presented in the second row. Asymmetries in the blue- and red-shifted peaks of the polarized flux are well visible. In the third row, the degree of polarization is presented. |
| In the text | |
|
Fig. 10. Schematic view of the polar and equatorial scattering regions that are detected at different position angles and their contribution to the polarized flux. |
| In the text | |
Current usage metrics show cumulative count of Article Views (full-text article views including HTML views, PDF and ePub downloads, according to the available data) and Abstracts Views on Vision4Press platform.
Data correspond to usage on the plateform after 2015. The current usage metrics is available 48-96 hours after online publication and is updated daily on week days.
Initial download of the metrics may take a while.