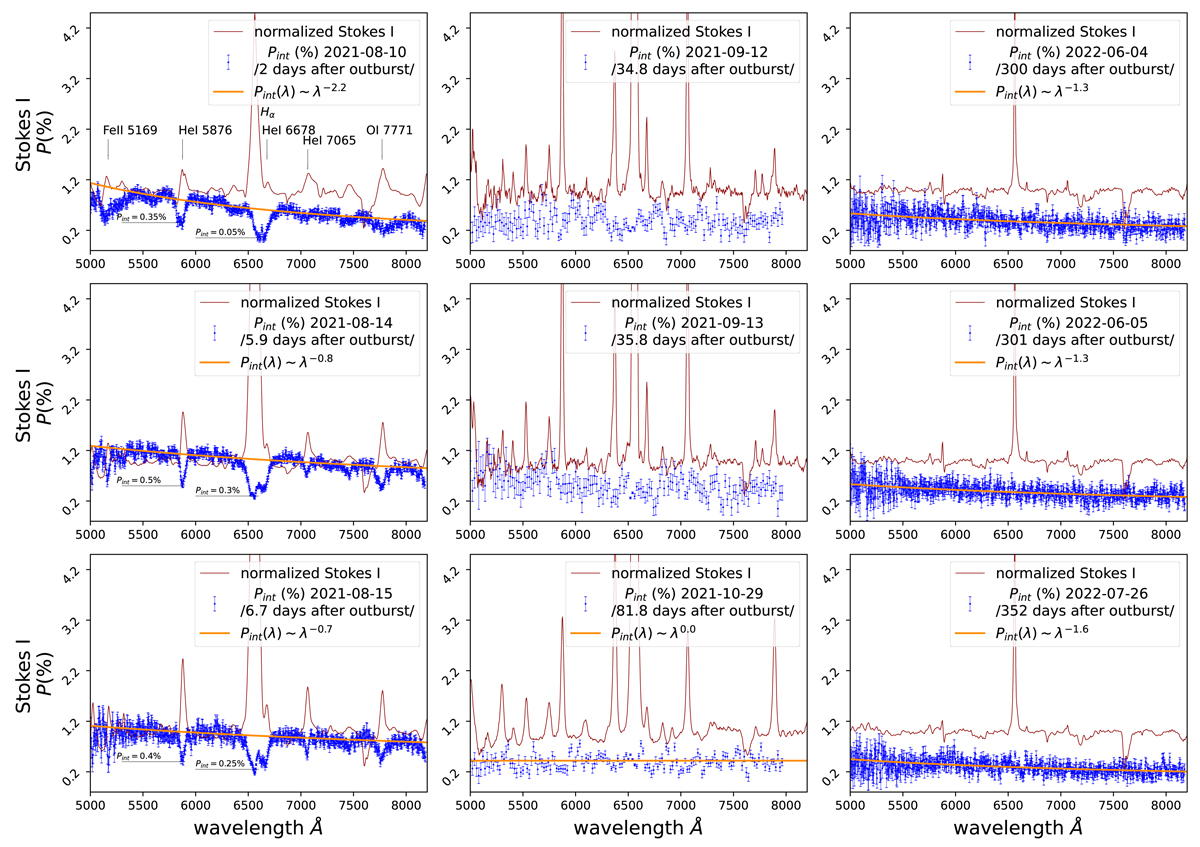
Fig. 5.
Download original image
Intrinsic polarization of RS Oph after the 2021 outburst. The degree of polarization is presented in blue. Strong depolarization effects are well visible in the first week after the start of the 2021 outburst (left column). The normalized intensity is presented in red. The orange line represents the power law fit of the degree of polarization data. The index of the power law increases in the first week after the start of the 2021 outburst (left column). Subsequently, from day 300 to day 352, the power law index decreases (right column).
Current usage metrics show cumulative count of Article Views (full-text article views including HTML views, PDF and ePub downloads, according to the available data) and Abstracts Views on Vision4Press platform.
Data correspond to usage on the plateform after 2015. The current usage metrics is available 48-96 hours after online publication and is updated daily on week days.
Initial download of the metrics may take a while.