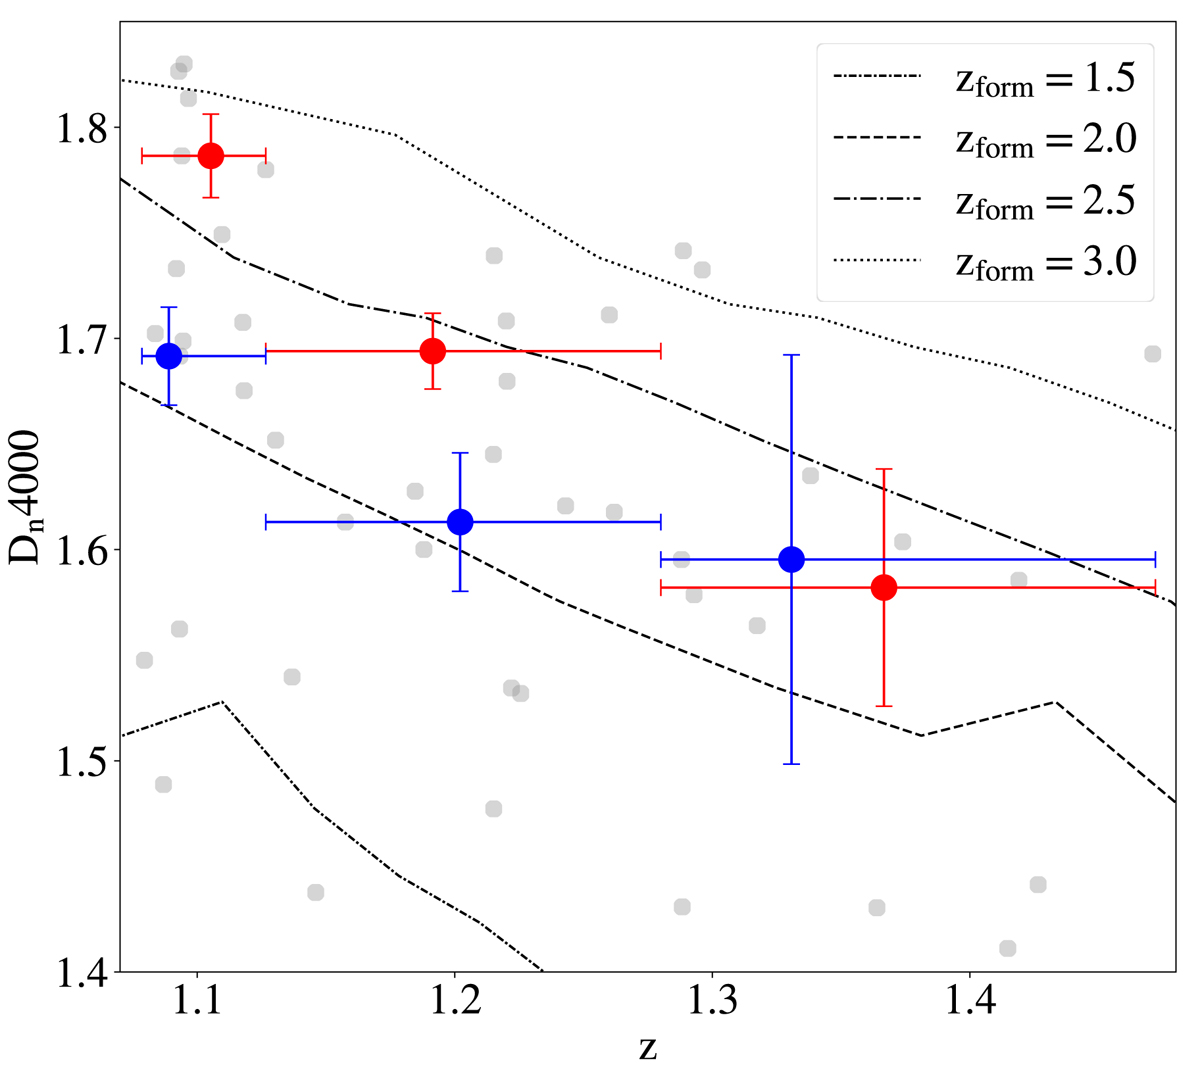
Fig. 4.
Download original image
Dn4000 trend with redshift. The measurements for the single objects of the CCs sample are shown in grey; blue and red dots are median values averaged in two mass bins, log(M⋆/M⊙)≤10.88 (high-mass) and log(M⋆/M⊙) > 10.88 (low-mass), respectively. The different lines show the Dn4000–z relation obtained from the 2016 version of the Bruzual & Charlot (2003) models at different formation redshifts and assuming a reference flat ΛCDM cosmology (ΩM = 0.3, ΩΛ = 0.7 and H0 = 70 km s−1 Mpc−1), purely for illustrative purposes. We note that, qualitatively, the observed trends follow the cosmological models quite well, but we defer to Sect. 4 the full cosmological analysis.
Current usage metrics show cumulative count of Article Views (full-text article views including HTML views, PDF and ePub downloads, according to the available data) and Abstracts Views on Vision4Press platform.
Data correspond to usage on the plateform after 2015. The current usage metrics is available 48-96 hours after online publication and is updated daily on week days.
Initial download of the metrics may take a while.