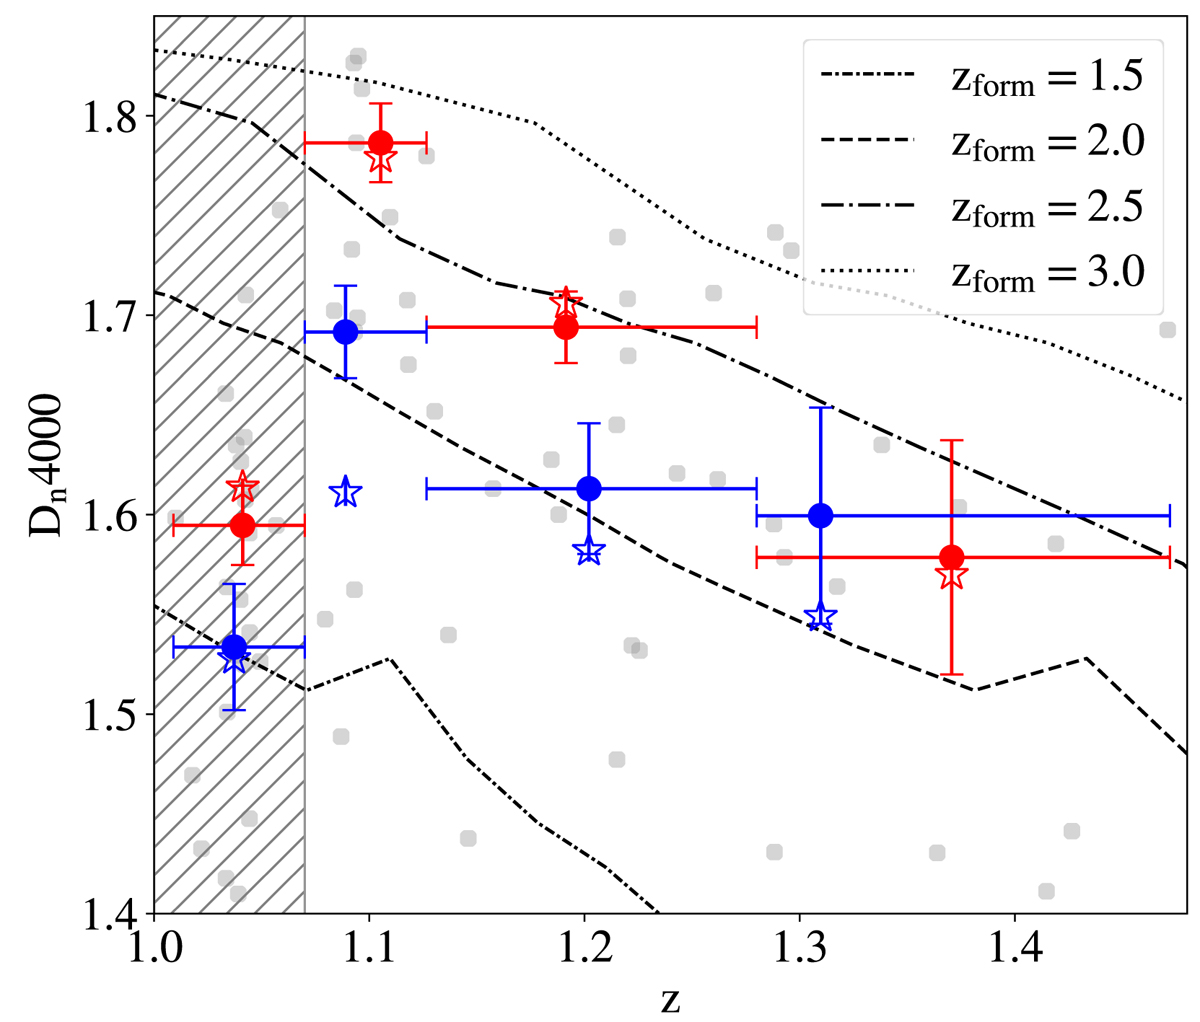
Fig. A.1.
Download original image
Dn4000 trend with redshift. In grey, we show the measurements for the single objects of the CCs sample; blue and red dots are median values for objects with log(M⋆/M⊙)≤10.86 (high-mass) and log(M⋆/M⊙) > 10.86 (low-mass), respectively; similarly, blue and red stars are measurements obtained on stacked spectra of low- and high-mass samples. In the background, lines refer to evolutionary models from Bruzual & Charlot (2003) at different formation redshifts.
Current usage metrics show cumulative count of Article Views (full-text article views including HTML views, PDF and ePub downloads, according to the available data) and Abstracts Views on Vision4Press platform.
Data correspond to usage on the plateform after 2015. The current usage metrics is available 48-96 hours after online publication and is updated daily on week days.
Initial download of the metrics may take a while.