Fig. 7.
Download original image
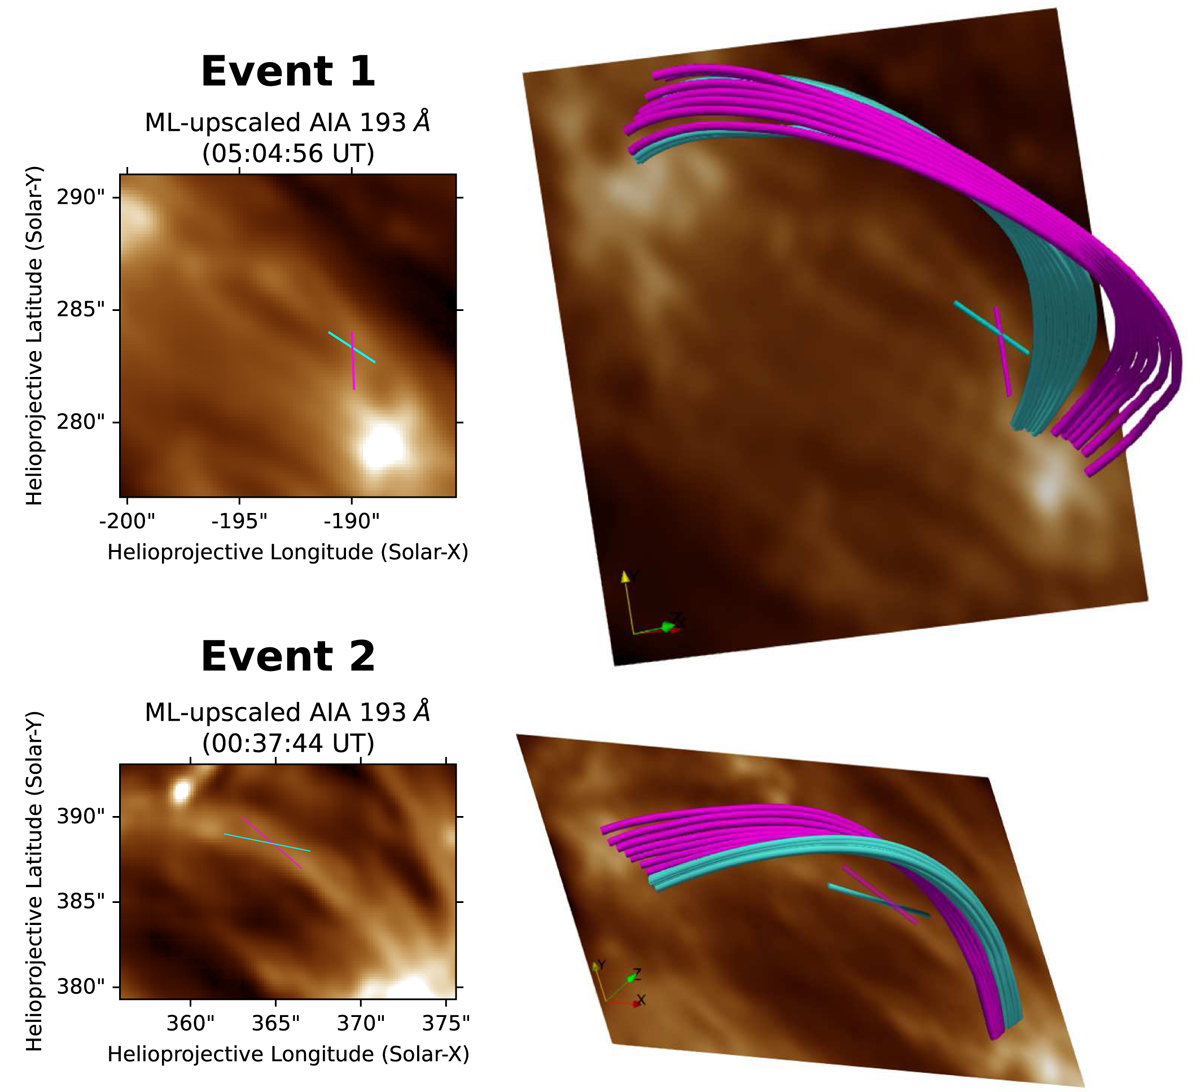
Modelled magnetic field lines matching the loops. Left column: ML-upscaled versions of AIA 193 Å images taken in Events 1 (top) and 2 (bottom), in which the magenta and cyan lines outline the two loop stands. The misalignment angle θ between the two lines amounts to 55° and 29° in Events 1 and 2, respectively. Right column: deposited upon the ML-upscaled AIA images, the field lines were traced from the NLFFF field. In Events 1 (top) and 2 (bottom), the NLFFF field was extrapolated based on the set of HMI vector data taken at 05:00:00 UT on 5 January 2012 and 00:36:00 UT on 22 June 2010, respectively.
Current usage metrics show cumulative count of Article Views (full-text article views including HTML views, PDF and ePub downloads, according to the available data) and Abstracts Views on Vision4Press platform.
Data correspond to usage on the plateform after 2015. The current usage metrics is available 48-96 hours after online publication and is updated daily on week days.
Initial download of the metrics may take a while.