Fig. 5.
Download original image
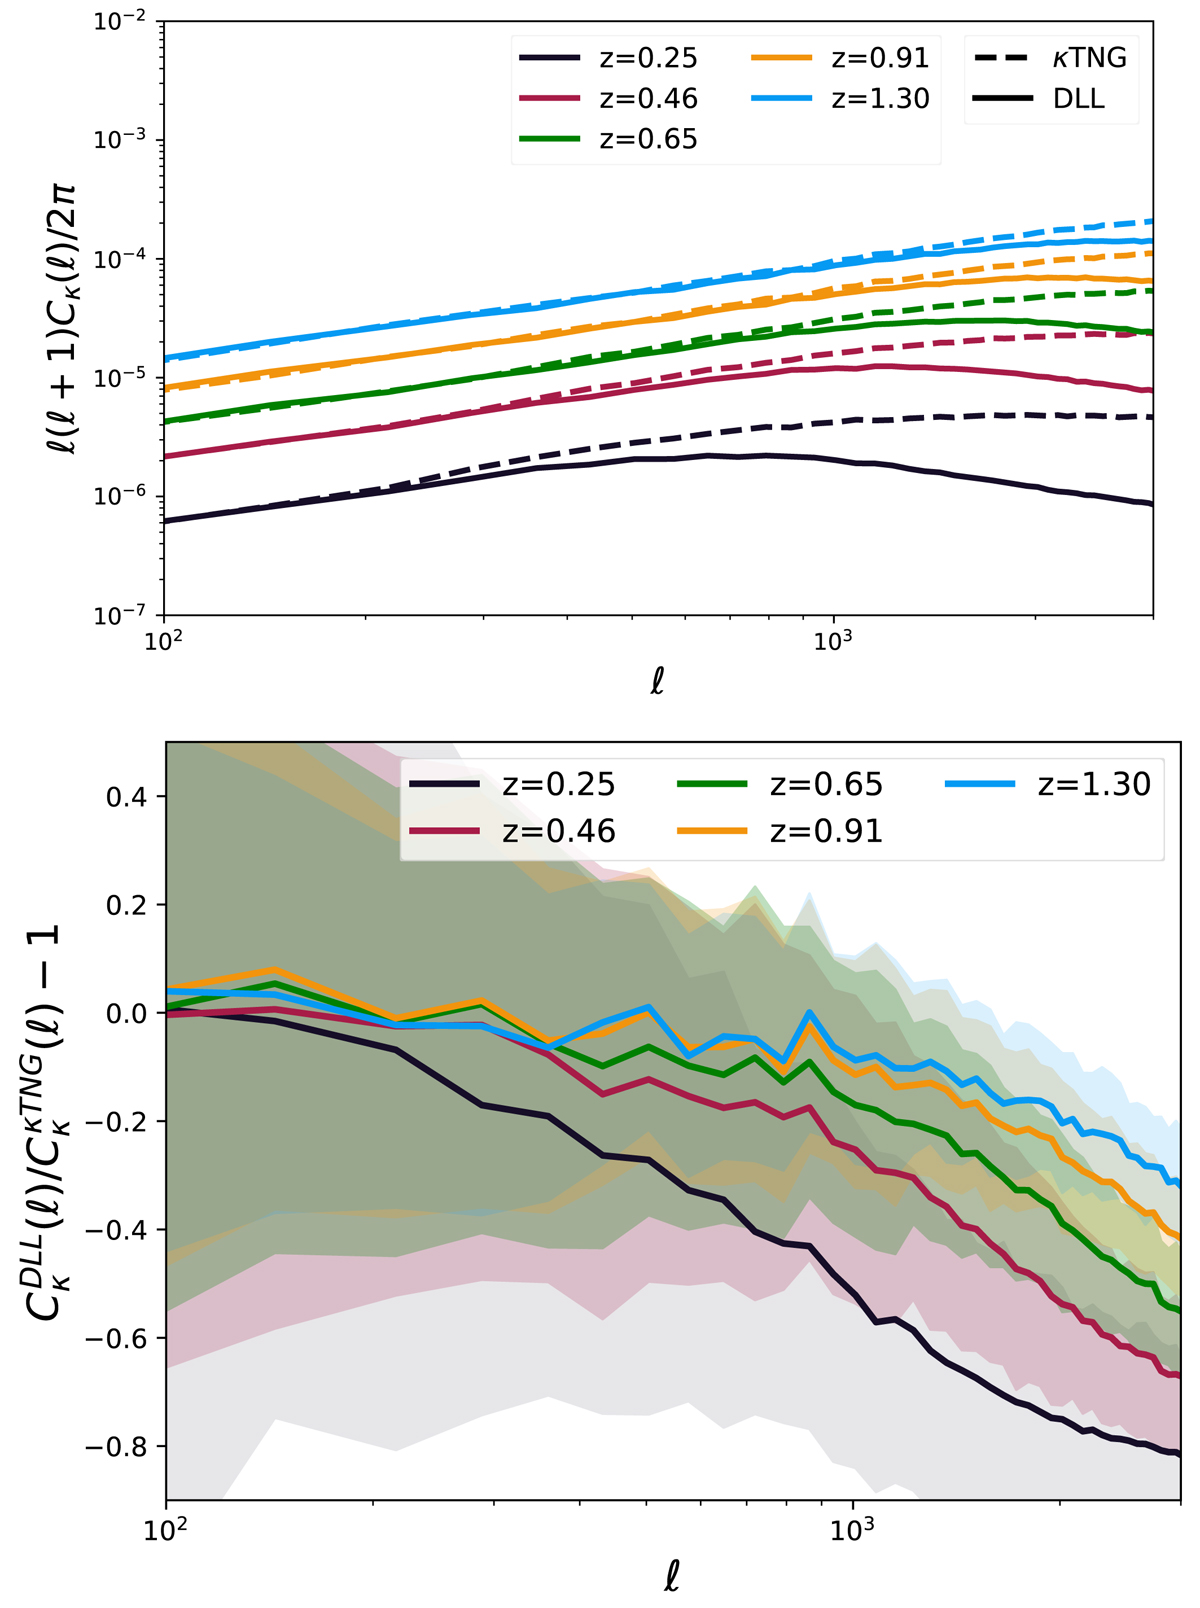
Validation of DLL simulations for 5 source redshift against κTNG-Dark simulations. Upper panel: angular power spectra from our DLL maps compared to the κTNG-Dark predictions. Lower panel: fractional angular power spectra of DLL simulations and κTNG-Dark simulations. The power spectra mean over 100 independent map realizations and the shaded regions represent the standard deviation from 100 independent DLL realizations.
Current usage metrics show cumulative count of Article Views (full-text article views including HTML views, PDF and ePub downloads, according to the available data) and Abstracts Views on Vision4Press platform.
Data correspond to usage on the plateform after 2015. The current usage metrics is available 48-96 hours after online publication and is updated daily on week days.
Initial download of the metrics may take a while.