Fig. 4.
Download original image
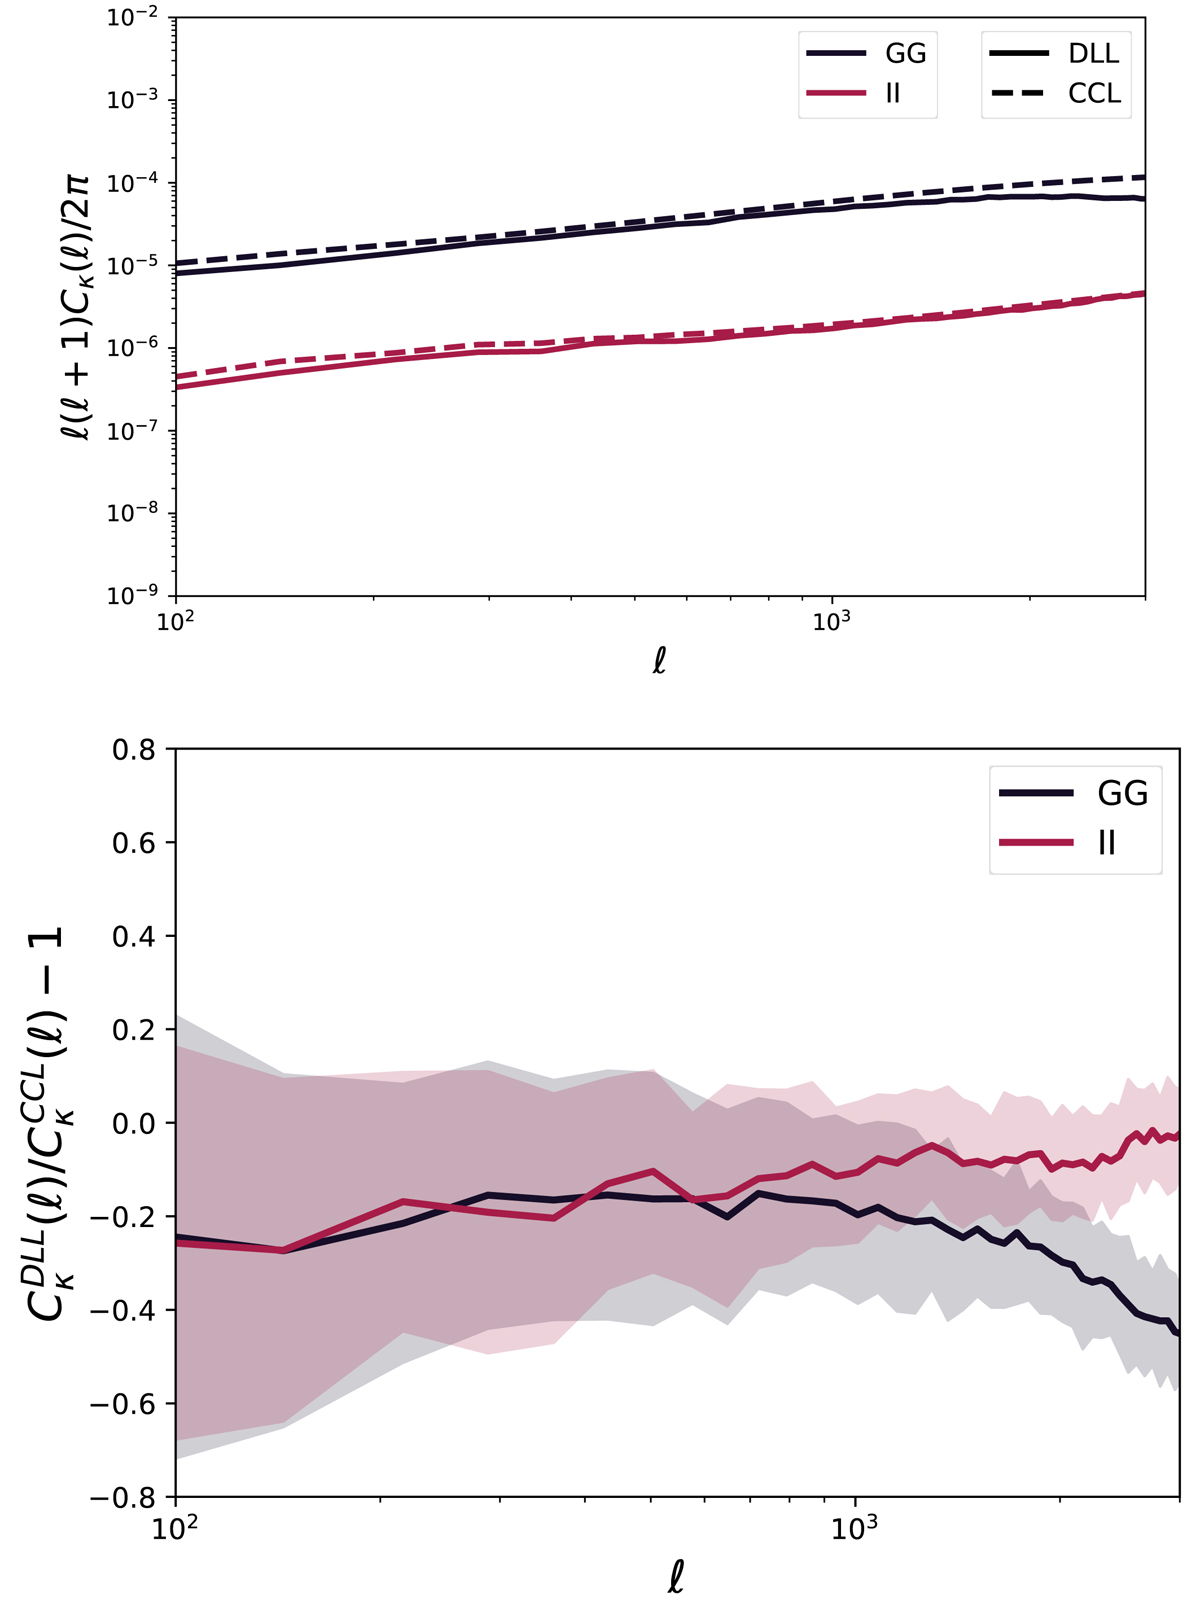
Validation of the intrinsic alignment implementation in DLL simulations compared to theoretical Halofit prediction. Upper panel: ![]() and
and ![]() contributions from theoretical predictions (dashed line) and DLL simulations. Lower panel: fractional difference between the theoretical and simulated
contributions from theoretical predictions (dashed line) and DLL simulations. Lower panel: fractional difference between the theoretical and simulated ![]() and
and ![]() contributes. We can see that we measure a reduced power spectrum at low ℓ compared to the theoretical predictions. This can be explained by the small volume of our simulation and the related low number of large-scale modes. The power spectra and ratios are means over 100 independent map realizations and the shaded regions represent the standard deviation from 100 realizations.
contributes. We can see that we measure a reduced power spectrum at low ℓ compared to the theoretical predictions. This can be explained by the small volume of our simulation and the related low number of large-scale modes. The power spectra and ratios are means over 100 independent map realizations and the shaded regions represent the standard deviation from 100 realizations.
Current usage metrics show cumulative count of Article Views (full-text article views including HTML views, PDF and ePub downloads, according to the available data) and Abstracts Views on Vision4Press platform.
Data correspond to usage on the plateform after 2015. The current usage metrics is available 48-96 hours after online publication and is updated daily on week days.
Initial download of the metrics may take a while.