Fig. 2.
Download original image
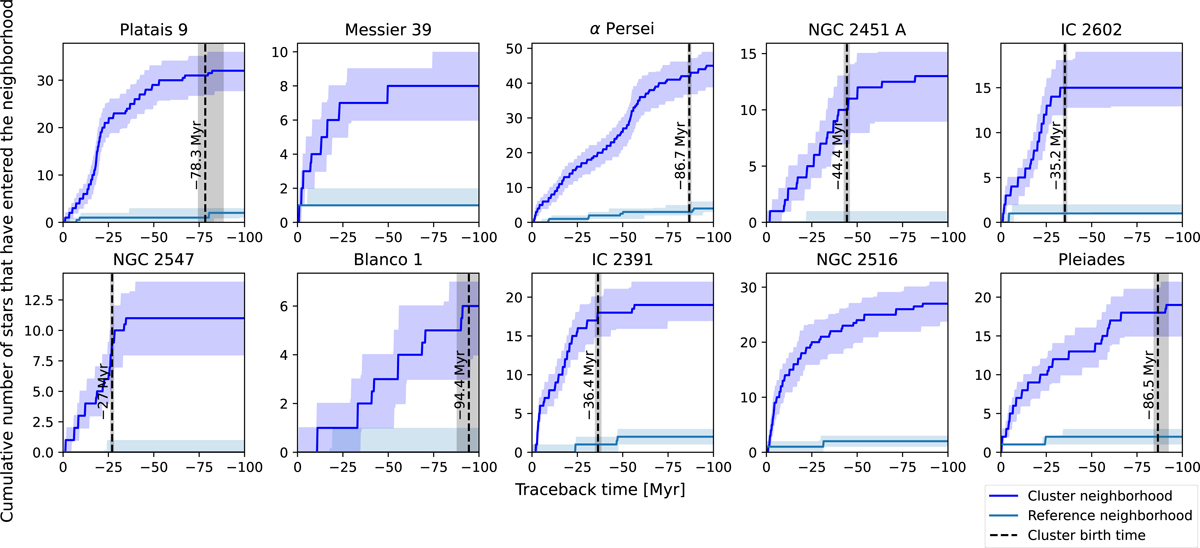
Comparison of the cumulative number of stars in the reference neighborhood (light blue) and the cumulative number of stars that enter the cluster neighborhood (dark blue). The solid lines show the median counts over the 100 Monte Carlo traceback computations. The colored areas show the 16th and 84th percentiles of the cumulative counts. The vertical dashed lines and gray bands mark the cluster ages and uncertainties according to Bossini et al. (2019), except for the two clusters that are much older than the maximum traceback time of 100 Myr. Many more stars enter the cluster neighborhood than the reference neighborhood, suggesting that there is indeed a population of escaped cluster stars that the traceback computations are able to find.
Current usage metrics show cumulative count of Article Views (full-text article views including HTML views, PDF and ePub downloads, according to the available data) and Abstracts Views on Vision4Press platform.
Data correspond to usage on the plateform after 2015. The current usage metrics is available 48-96 hours after online publication and is updated daily on week days.
Initial download of the metrics may take a while.