Fig. 4
Download original image
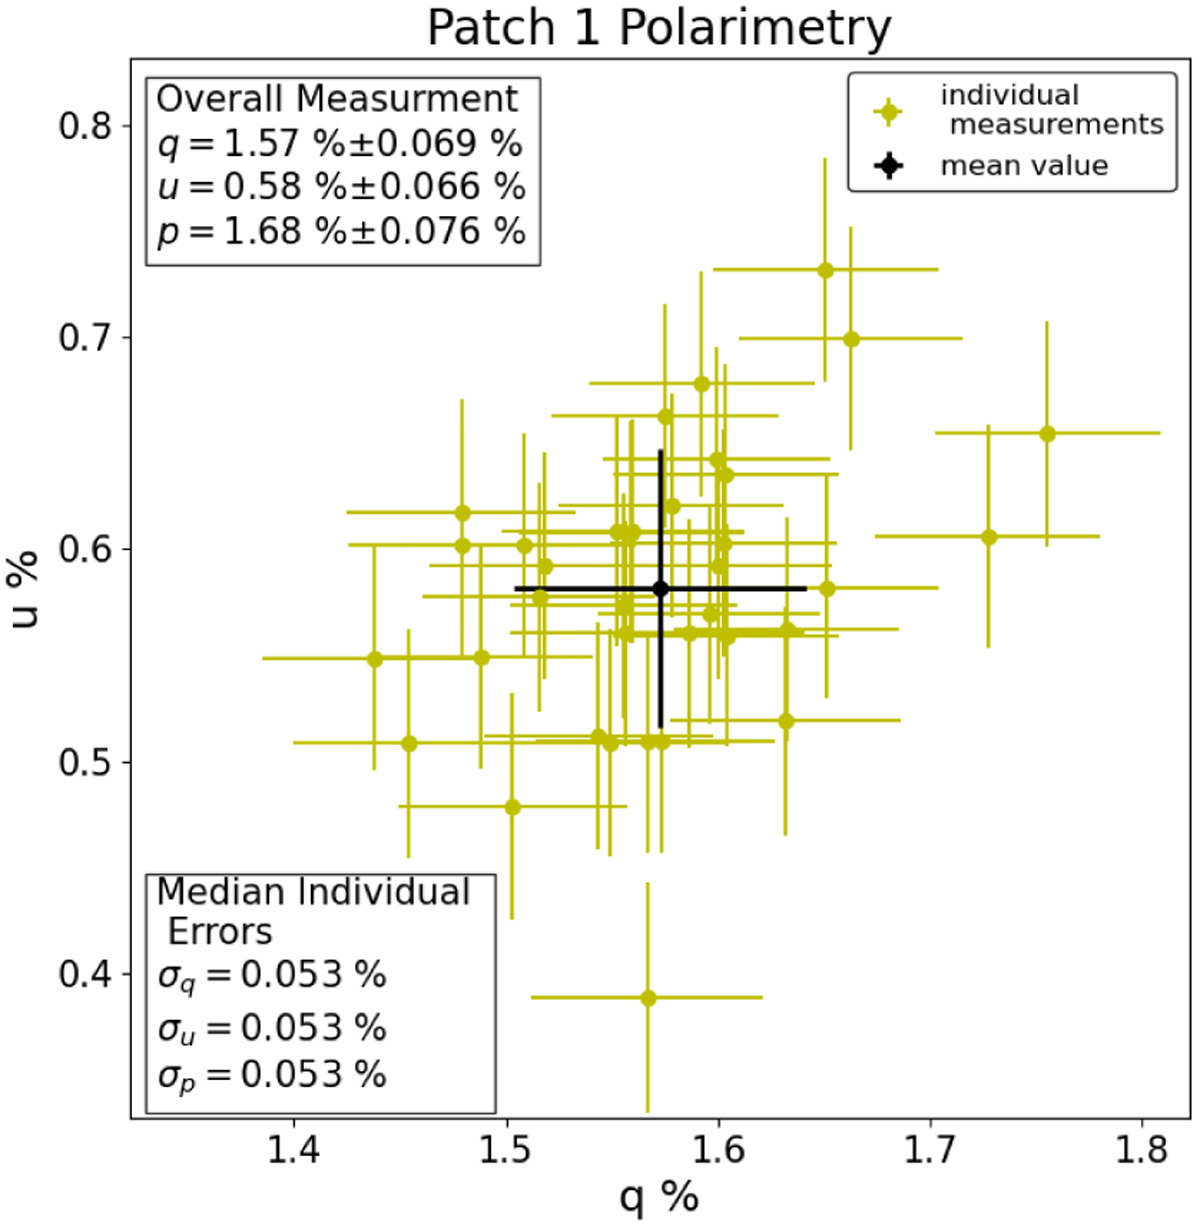
Measured q and u values for all the pointing for patch 1 (yellow crosses) as well as the overall mean value and the measured standard deviation (black cross), whose values are mentioned in the top left legend. The median individual errors in the bottom left legend refer to the median of expected errors in the Stokes parameters owing to photon noise across the grid points. The value of the degree of linear polarization, p, is presented without any correction for polarimetric bias; p is calculated for each grid point and then their mean and variance are found, similar to q and u.
Current usage metrics show cumulative count of Article Views (full-text article views including HTML views, PDF and ePub downloads, according to the available data) and Abstracts Views on Vision4Press platform.
Data correspond to usage on the plateform after 2015. The current usage metrics is available 48-96 hours after online publication and is updated daily on week days.
Initial download of the metrics may take a while.