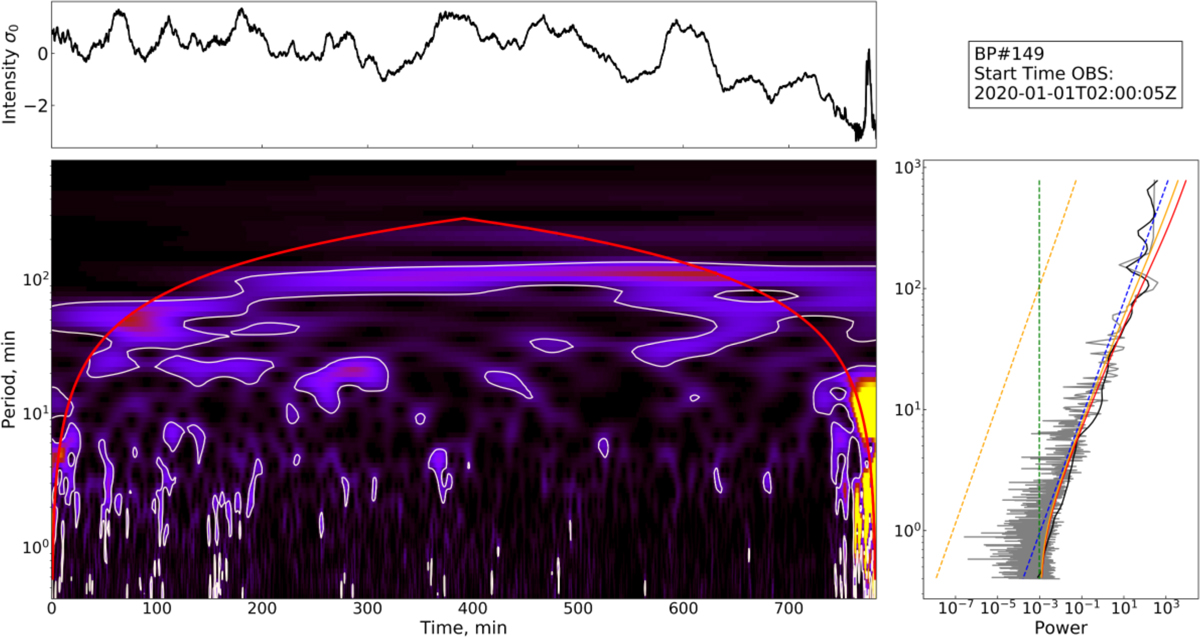
Fig. 9.
Download original image
1D CWT applied to BP#149. The top panel shows the time series of the average BP intensity normalised by the standard deviation of the time series. The bottom-left panel shows the wavelet power, with the COI in red and the global confidence shown within the white contours. The bottom-right panel shows the normalised Fourier spectrum in grey, the global wavelet spectrum in black, the global significance level in red, and the local significance level in orange. The noise model components are shown as follows: power law in dashed orange, the kappa function in dashed blue, and the white noise in dashed green.
Current usage metrics show cumulative count of Article Views (full-text article views including HTML views, PDF and ePub downloads, according to the available data) and Abstracts Views on Vision4Press platform.
Data correspond to usage on the plateform after 2015. The current usage metrics is available 48-96 hours after online publication and is updated daily on week days.
Initial download of the metrics may take a while.