Fig. 4.
Download original image
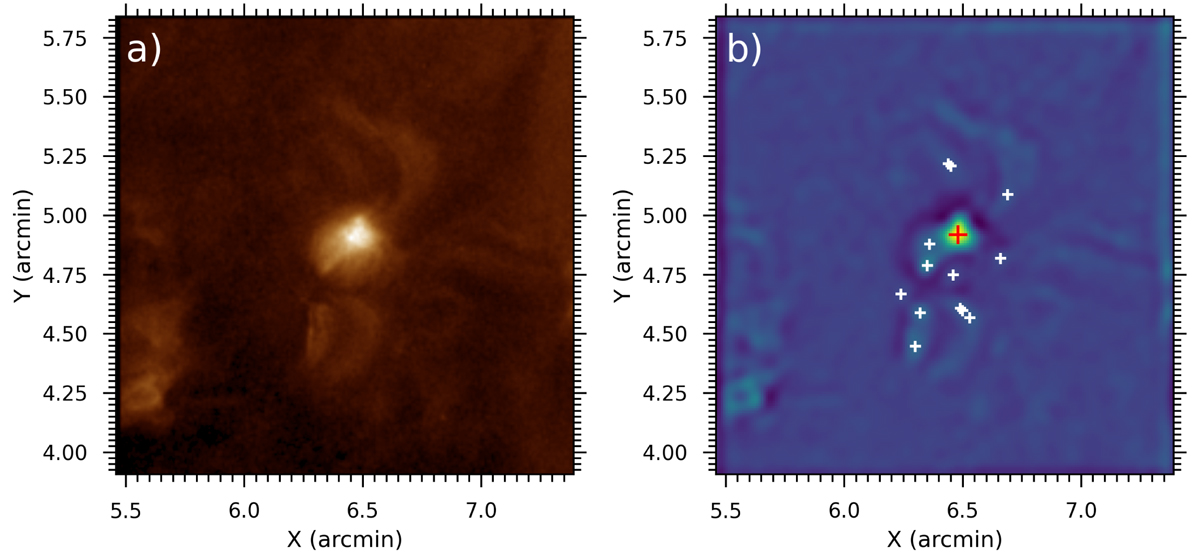
Sub-image of BP #149 and the corresponding CWT image. Panel a: AIA 193 Å example BP #149 on 01 January 2020 at 01:59:59 UT. Panel b: application of a CWT at scale aBP. White crosses highlight the maxima in the CWT, which exceed the threshold value after the application of a 2D weighted Gaussian to the CWT image. The red cross highlights the maxima closest to the centre of the image.
Current usage metrics show cumulative count of Article Views (full-text article views including HTML views, PDF and ePub downloads, according to the available data) and Abstracts Views on Vision4Press platform.
Data correspond to usage on the plateform after 2015. The current usage metrics is available 48-96 hours after online publication and is updated daily on week days.
Initial download of the metrics may take a while.