Fig. 3.
Download original image
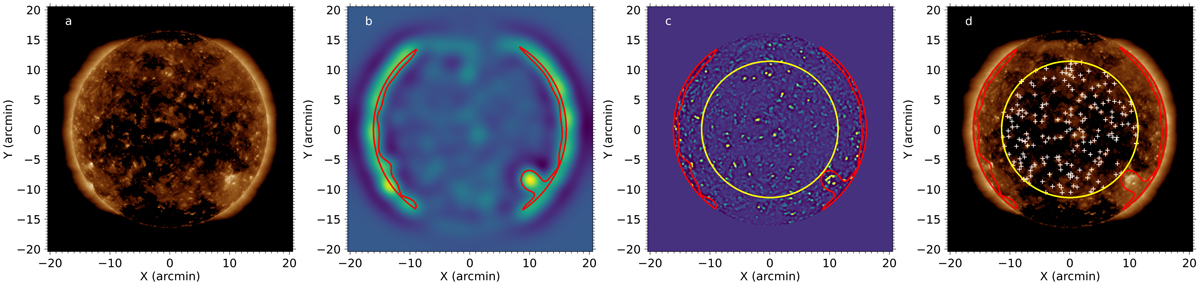
Full disk AIA and CWT images illustrating the detection of BPs. Panel a: full disk AIA 193 Å on 01 January 2020 at 01:00:05 UT. Panel b: 2D CWT at the active region scale, aAR. The active region is detected by applying a threshold value at the 97th percentile of the CWT value. This threshold area is the area within the red contour. Panel c: 2D CWT at the BP scale, aBP. The active region is masked by removing the area denoted by the red contour, as in panel b. The larger black circle is applied at 0.7 R⊙, obscuring limb, off-limb, and edge effects. In this case, the active region mask is outside the limb mask. Panel d: full disk AIA 193 Å on 01 January 2020 at 01:00:05 UT. Candidate BPs are shown as white crosses. Masked areas are denoted by red and black contours.
Current usage metrics show cumulative count of Article Views (full-text article views including HTML views, PDF and ePub downloads, according to the available data) and Abstracts Views on Vision4Press platform.
Data correspond to usage on the plateform after 2015. The current usage metrics is available 48-96 hours after online publication and is updated daily on week days.
Initial download of the metrics may take a while.