Fig. 12.
Download original image
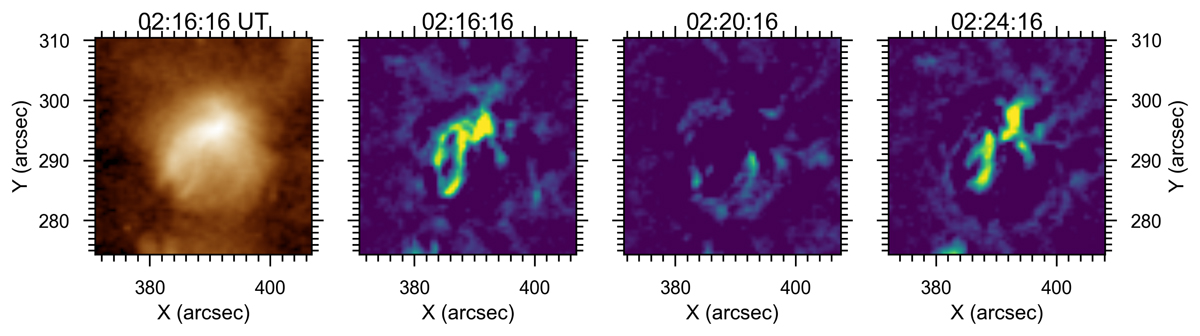
Illustration of the process of bandpass-filtering the BP region. The leftmost panel shows the AIA 193 Å image at the beginning of the time range of interest. The remaining three panels show images at three times separated by 4 min. At each pixel, the time series has been bandpass-filtered around the period of 8 min with a Hann filter with a typical width equal to the mode frequency. The temporal evolution of the bandpass-filtered images is available as an online movie.
Current usage metrics show cumulative count of Article Views (full-text article views including HTML views, PDF and ePub downloads, according to the available data) and Abstracts Views on Vision4Press platform.
Data correspond to usage on the plateform after 2015. The current usage metrics is available 48-96 hours after online publication and is updated daily on week days.
Initial download of the metrics may take a while.