Fig. A.1
Download original image
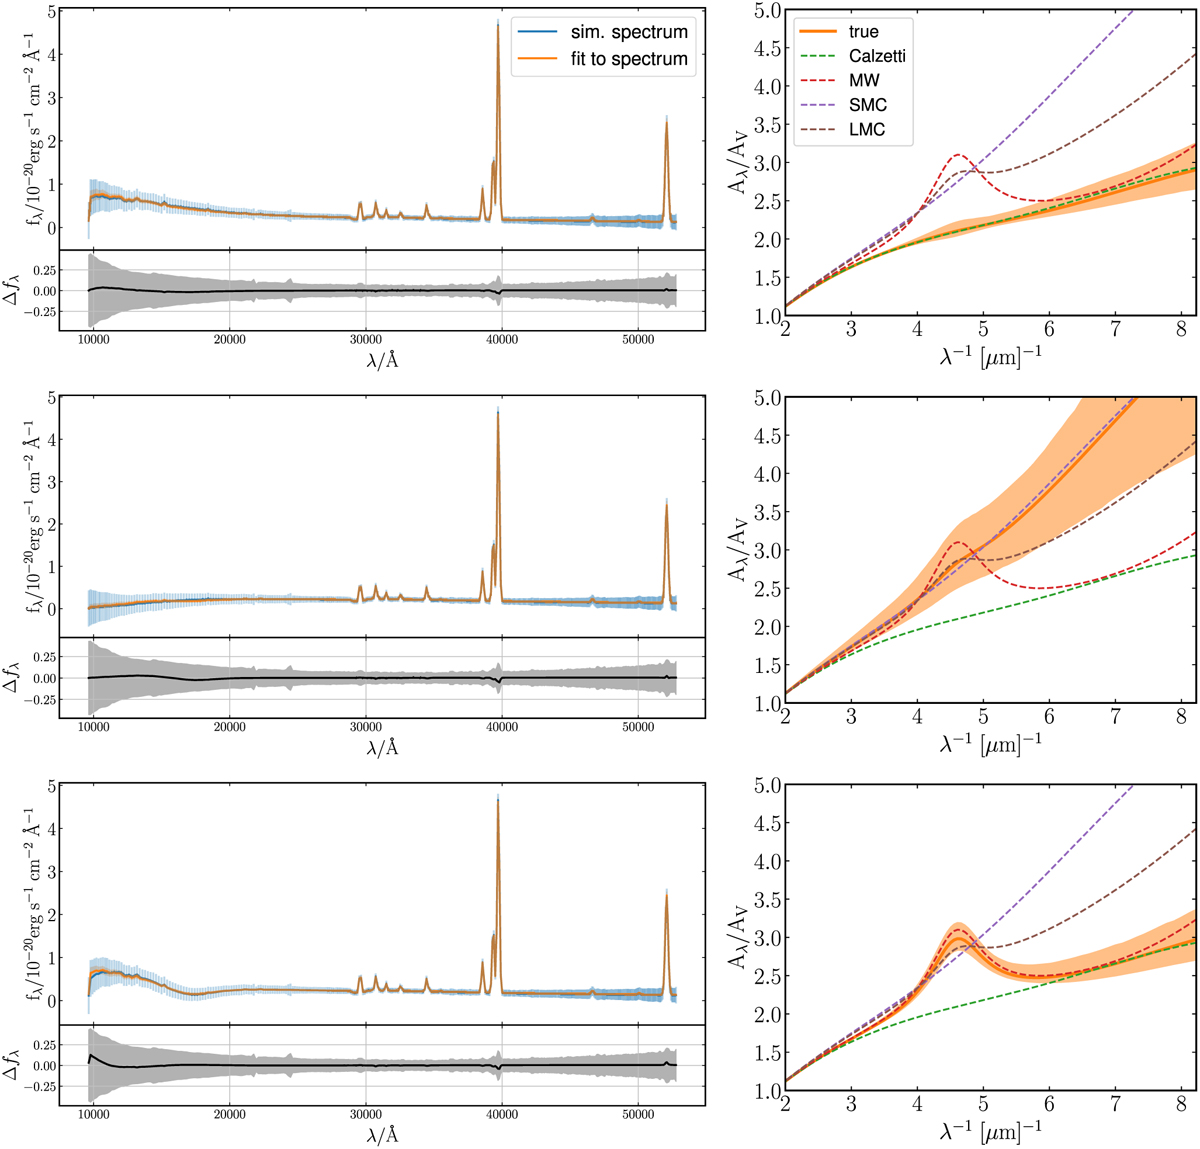
Synthetic dust-attenuated spectra of s01143 source, generated by using the SED fitting method, assuming the fiducial SFH, and adopting one of the empirical dust curves (top-left). The a priori adopted dust curves are the Calzetti attenuation law, and the SMC and the MW extinction curves (from top to bottom panels, respectively). The model spectra of our source are shown in blue, with flux uncertainties illustrated in pale blue. Orange and pale orange colors indicate the best-fit posterior spectra with 1er uncertainties, respectively. Bottom-left panel shows the residuals of the best fit on the synthetic spectra Δfλ with 1σ uncertainties. Right: The corresponding best-fit dust attenuation curve with 1σ uncertainties, on empirical dust curves. Drude model fits to empirical curves: the Calzetti, the SMC, the LMC, and the MW curves are shown as green, red, purple, and brown dashed lines, respectively.
Current usage metrics show cumulative count of Article Views (full-text article views including HTML views, PDF and ePub downloads, according to the available data) and Abstracts Views on Vision4Press platform.
Data correspond to usage on the plateform after 2015. The current usage metrics is available 48-96 hours after online publication and is updated daily on week days.
Initial download of the metrics may take a while.