Fig. 2
Download original image
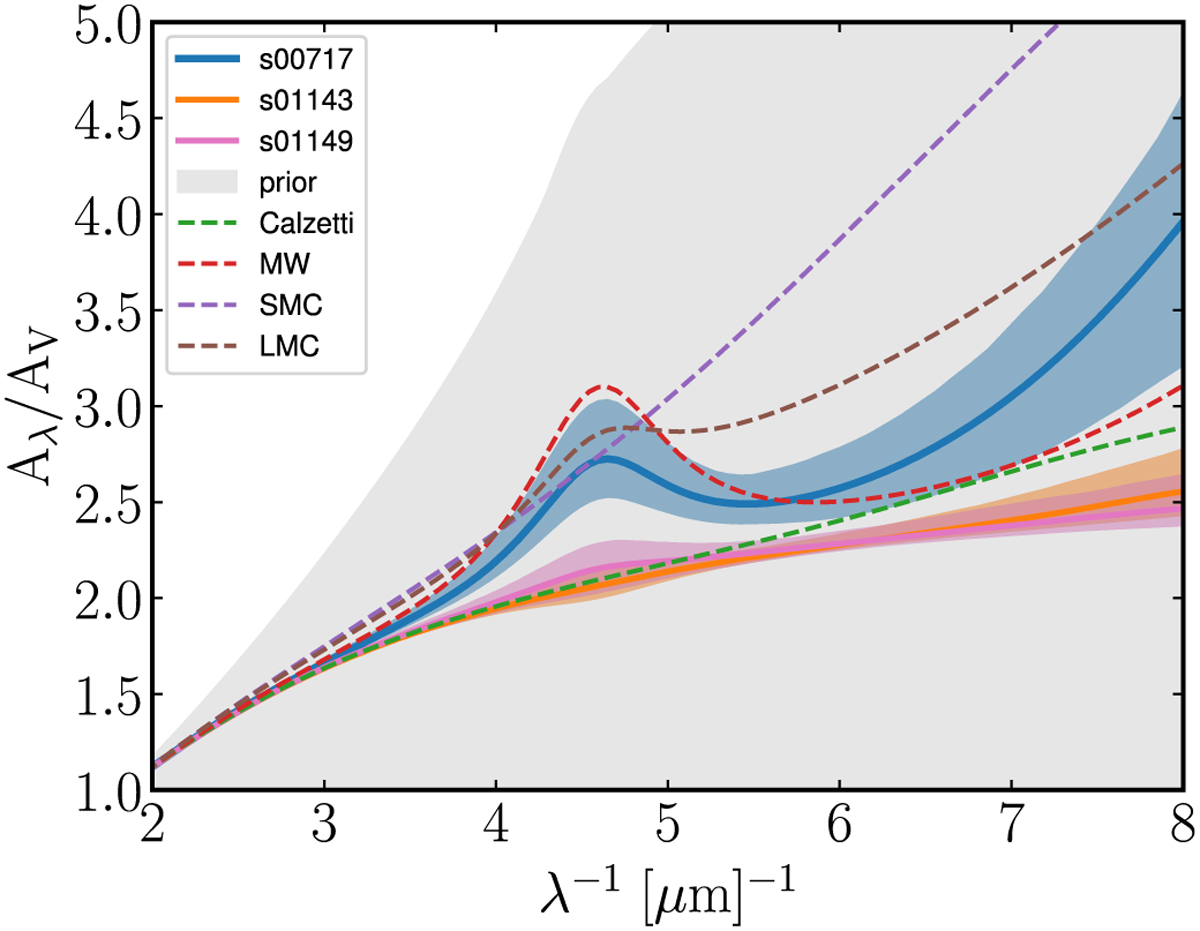
Best-fit dust attenuation curves obtained using the SED fitting method with the non-parametric SFH model, for our three sources. The median of the posterior with 1er uncertainties are shown as blue, orange, and pink solid lines with associated shaded regions for s00717, s01143, and s01149, respectively. The 3σ dispersion of the prior is estimated from a 99.7% sample of 1000 random draws from the prior limits for c1 − c4 parameters of the Drude model (gray shaded region). Drude model fits to the Calzetti, the MW, the SMC, and the LMC empirical curves are shown as in Fig. 1.
Current usage metrics show cumulative count of Article Views (full-text article views including HTML views, PDF and ePub downloads, according to the available data) and Abstracts Views on Vision4Press platform.
Data correspond to usage on the plateform after 2015. The current usage metrics is available 48-96 hours after online publication and is updated daily on week days.
Initial download of the metrics may take a while.