Fig. 1
Download original image
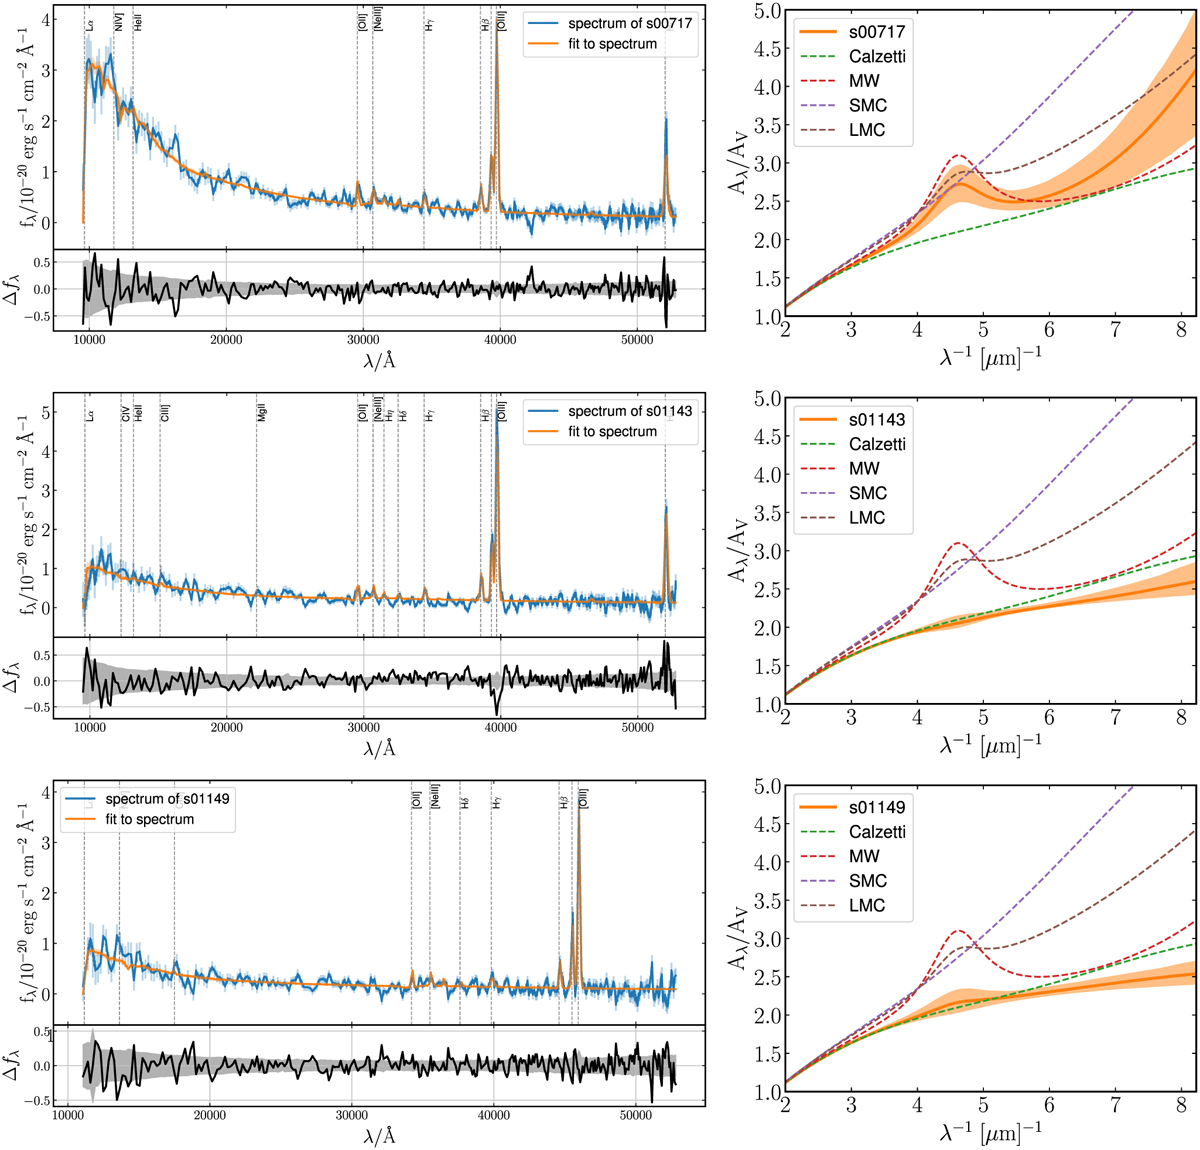
Best fit on the SED and the inferred attenuation curves of three galaxies at the EoR. The left panels show the NIRSpec JWST spectrum of s00717 (top), s01143 (middle), and s01149 (bottom) in blue, with flux uncertainties illustrated in pale blue. Orange and pale orange colors indicate the best-fit posterior spectrum with 1σ uncertainties, respectively. Vertical dashed lines mark the prominent detected emission lines and positions of potential lines present in the spectra. In the bottom panel of each plot, we show the residuals of the best fit on the observed spectra, Δfλ, with 1σ uncertainties. The right panels depict the best-fit dust attenuation curves with 1σ uncertainties for s00717, s01143, and s01149 sources, which were obtained using the SED fitting method with the non-parametric SFH model. Drude model fits to the Calzetti, the MW, the SMC, and the LMC empirical curves are shown as green, red, purple, and brown dashed lines, respectively.
Current usage metrics show cumulative count of Article Views (full-text article views including HTML views, PDF and ePub downloads, according to the available data) and Abstracts Views on Vision4Press platform.
Data correspond to usage on the plateform after 2015. The current usage metrics is available 48-96 hours after online publication and is updated daily on week days.
Initial download of the metrics may take a while.