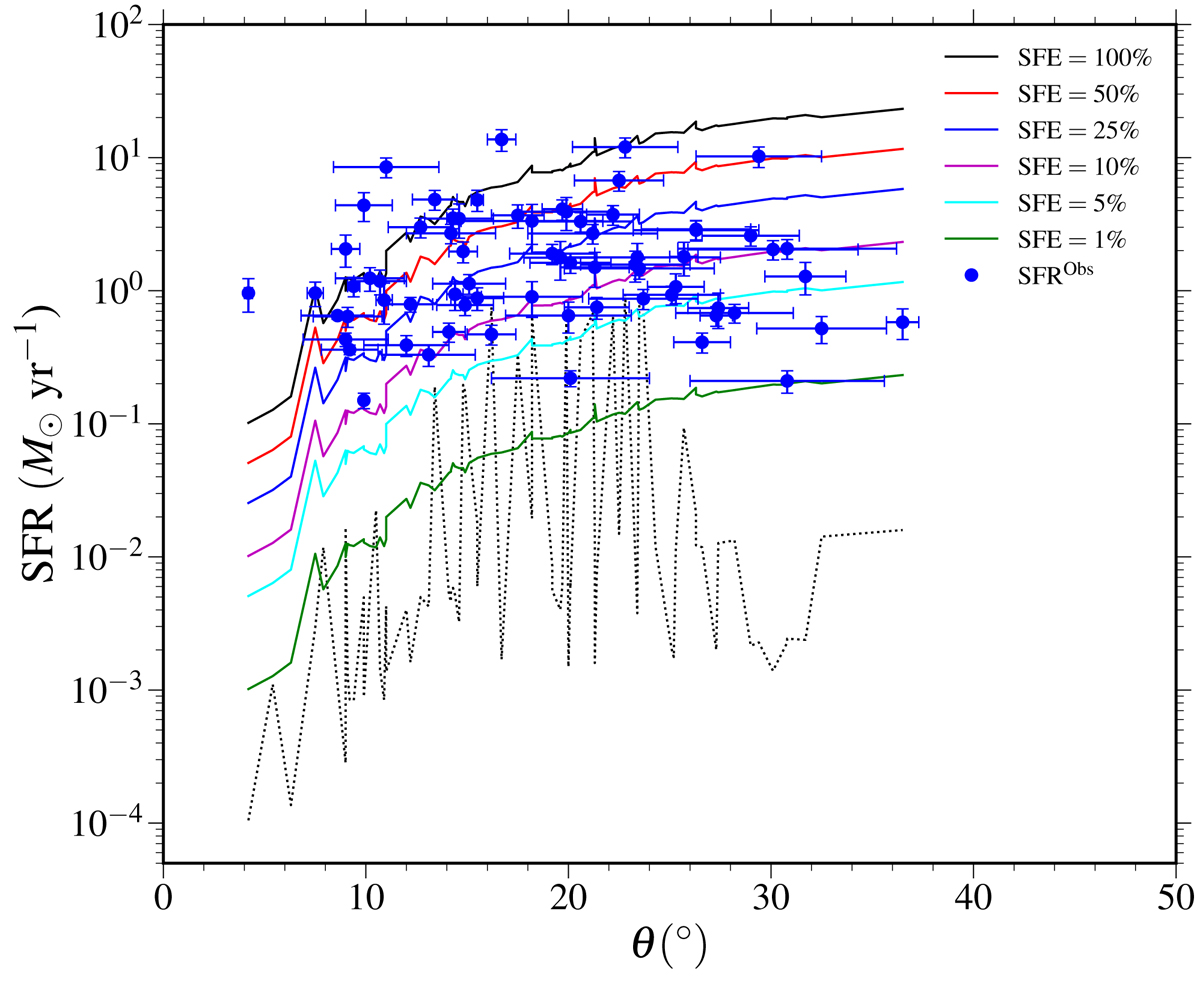
Fig. 7.
Download original image
Model-calculated maximum and minimum SFRs in terms of pitch angle (θ) for 79 spiral galaxies. The solid and dotted black lines indicate the maximum and minimum of theoretically estimated SFRs at SFE = 100%. The colored solid lines are the maximum SFRs at different SFEs. The solid blue circles represent the observed SFRs (SFRObs) (Catalán-Torrecilla et al. 2015). See the text for details.
Current usage metrics show cumulative count of Article Views (full-text article views including HTML views, PDF and ePub downloads, according to the available data) and Abstracts Views on Vision4Press platform.
Data correspond to usage on the plateform after 2015. The current usage metrics is available 48-96 hours after online publication and is updated daily on week days.
Initial download of the metrics may take a while.