Fig. 1
Download original image
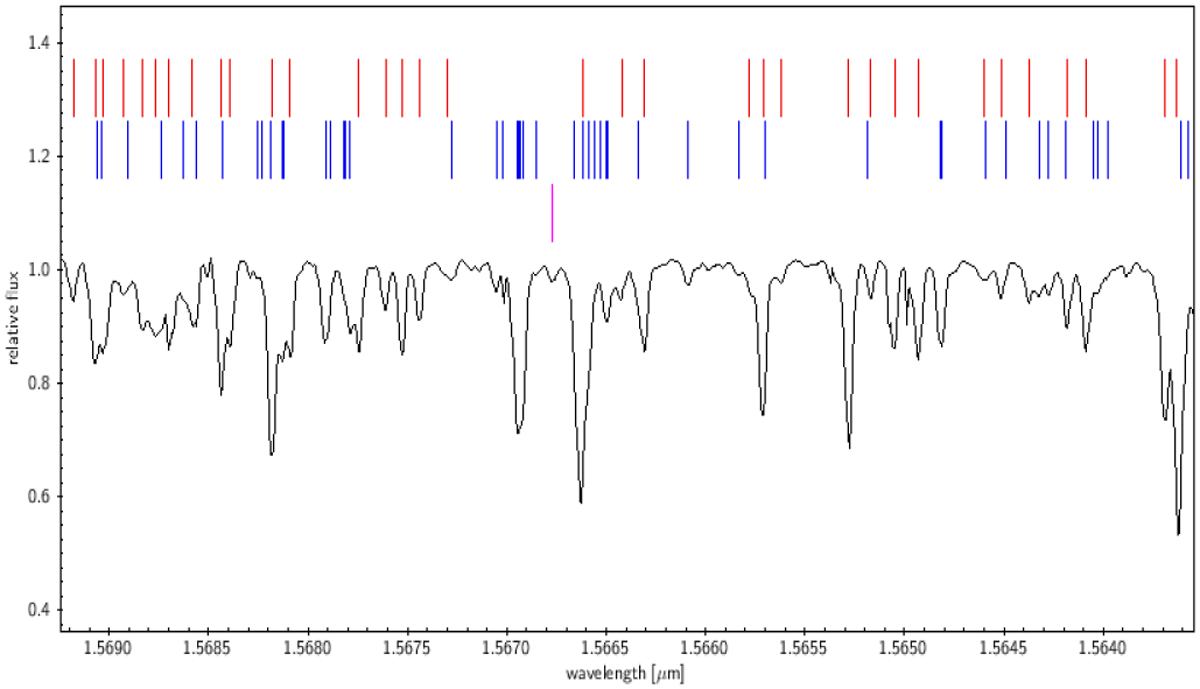
Example section from the 10 Leo spectrum. Identified lines are marked by vertical strokes. The top row (red) corresponds to line identifications in common with the Arcturus atlas. The second row (blue) are identifications attributed based on our model calculations. The single magenta line in the third row indicates an as of yet unidentified feature.
Current usage metrics show cumulative count of Article Views (full-text article views including HTML views, PDF and ePub downloads, according to the available data) and Abstracts Views on Vision4Press platform.
Data correspond to usage on the plateform after 2015. The current usage metrics is available 48-96 hours after online publication and is updated daily on week days.
Initial download of the metrics may take a while.