Fig. 7.
Download original image
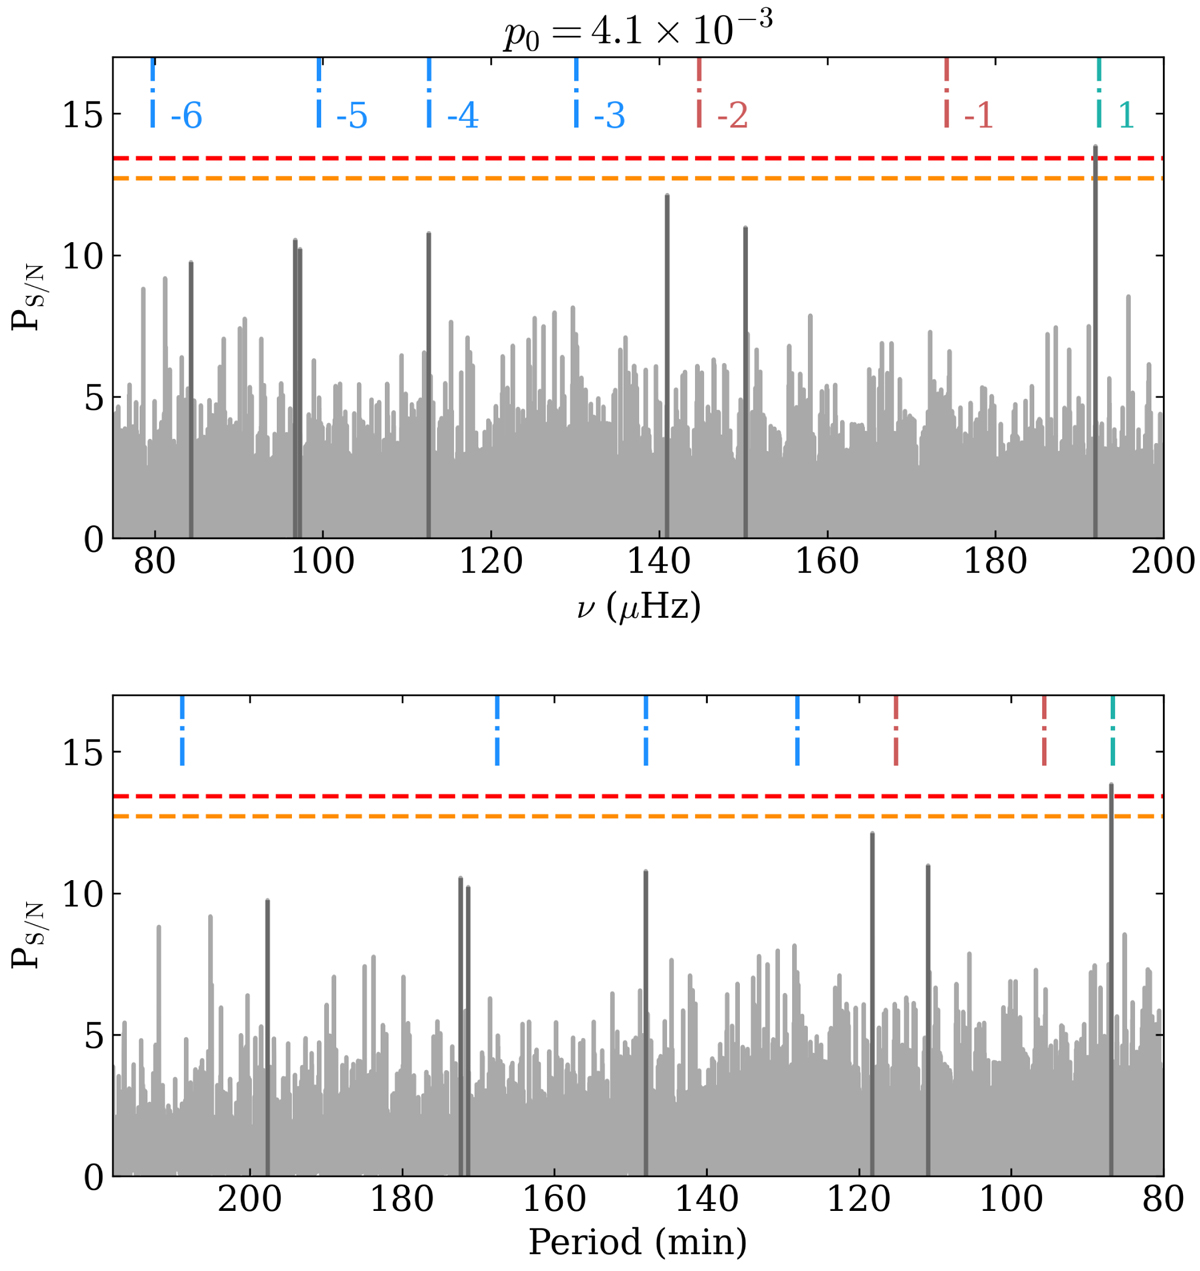
PS/N (grey) obtained for KIC 6679371, with the x-axis scaled in frequency (top) and in period (bottom). The dashed horizontal orange and red lines correspond to the pdet = 0.1 and 0.05 detection thresholds computed from Eq. (6), respectively. The peaks included when computing the pattern probability p0 are shown in darker grey. The mode frequencies computed with GYRE for ℓ = 1, m = 0 modes are shown for pure g modes (light blue), g-dominated mixed modes (red), and g-dominated mixed modes (green). The order n of each modes is shown in the figure.
Current usage metrics show cumulative count of Article Views (full-text article views including HTML views, PDF and ePub downloads, according to the available data) and Abstracts Views on Vision4Press platform.
Data correspond to usage on the plateform after 2015. The current usage metrics is available 48-96 hours after online publication and is updated daily on week days.
Initial download of the metrics may take a while.