Open Access
Fig. 6.
Download original image
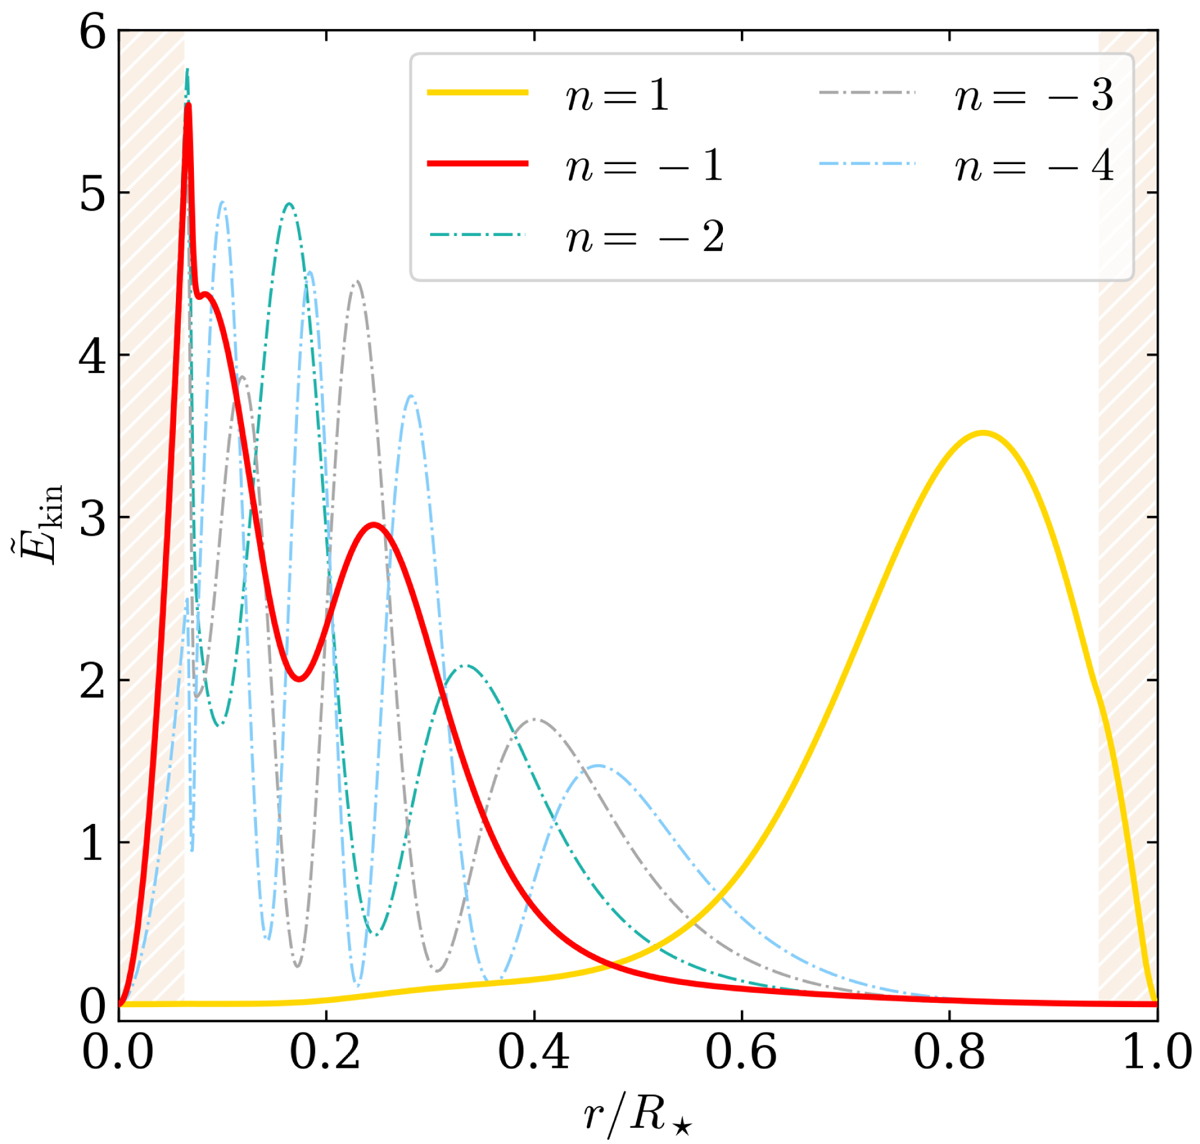
Normalised kinetic energy density profile ![]() profiles for the ℓ = 1, m = 0, n = 1 (yellow), −1 (red), −2 (cyan), −3 (grey), and −4 (blue) modes computed with GYRE for our KIC 3733735 reference model. The hatched areas correspond to convective regions. The n ≤ −2 modes are shown by the dash-dotted lines for readability.
profiles for the ℓ = 1, m = 0, n = 1 (yellow), −1 (red), −2 (cyan), −3 (grey), and −4 (blue) modes computed with GYRE for our KIC 3733735 reference model. The hatched areas correspond to convective regions. The n ≤ −2 modes are shown by the dash-dotted lines for readability.
Current usage metrics show cumulative count of Article Views (full-text article views including HTML views, PDF and ePub downloads, according to the available data) and Abstracts Views on Vision4Press platform.
Data correspond to usage on the plateform after 2015. The current usage metrics is available 48-96 hours after online publication and is updated daily on week days.
Initial download of the metrics may take a while.