Fig. 18.
Download original image
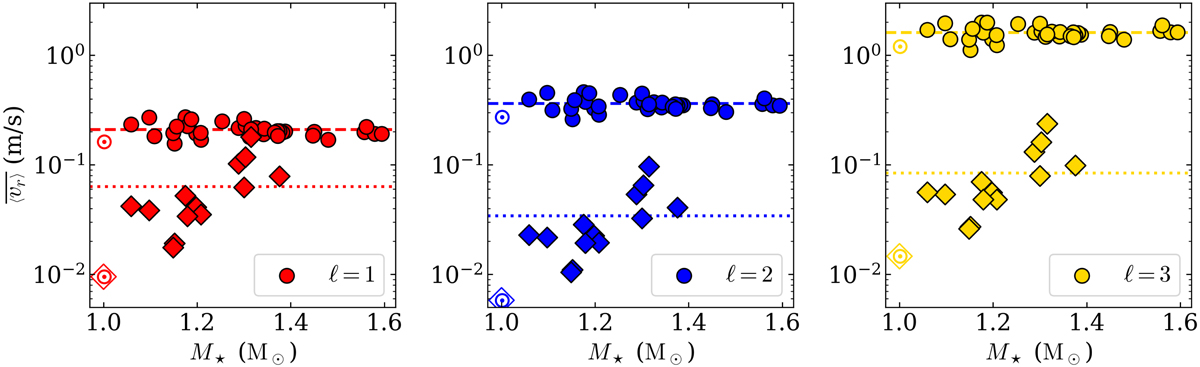
Frequency-averaged velocity level ![]() as a function of M⋆ measured above 125 μHz (circles,
as a function of M⋆ measured above 125 μHz (circles, ![]() ) and below 30 μHz (diamonds,
) and below 30 μHz (diamonds, ![]() ) for the stars in our sample and for ℓ = 1 (left), ℓ = 2 (centre), and ℓ = 3 (right) modes. To avoid biases in the comparison, we do not consider
) for the stars in our sample and for ℓ = 1 (left), ℓ = 2 (centre), and ℓ = 3 (right) modes. To avoid biases in the comparison, we do not consider ![]() for stars with νc, 1 < 40 μHz. In each panel, the mean values of the
for stars with νc, 1 < 40 μHz. In each panel, the mean values of the ![]() and
and ![]() distributions are shown by the dashed and dotted lines, respectively. In each panel, the mean velocity levels computed with the VIRGO/SPM solar time series
distributions are shown by the dashed and dotted lines, respectively. In each panel, the mean velocity levels computed with the VIRGO/SPM solar time series ![]() are shown using the usual solar symbol, ⊙. The solar symbol enclosed by a square corresponds to
are shown using the usual solar symbol, ⊙. The solar symbol enclosed by a square corresponds to ![]() , while the other corresponds to
, while the other corresponds to ![]() .
.
Current usage metrics show cumulative count of Article Views (full-text article views including HTML views, PDF and ePub downloads, according to the available data) and Abstracts Views on Vision4Press platform.
Data correspond to usage on the plateform after 2015. The current usage metrics is available 48-96 hours after online publication and is updated daily on week days.
Initial download of the metrics may take a while.