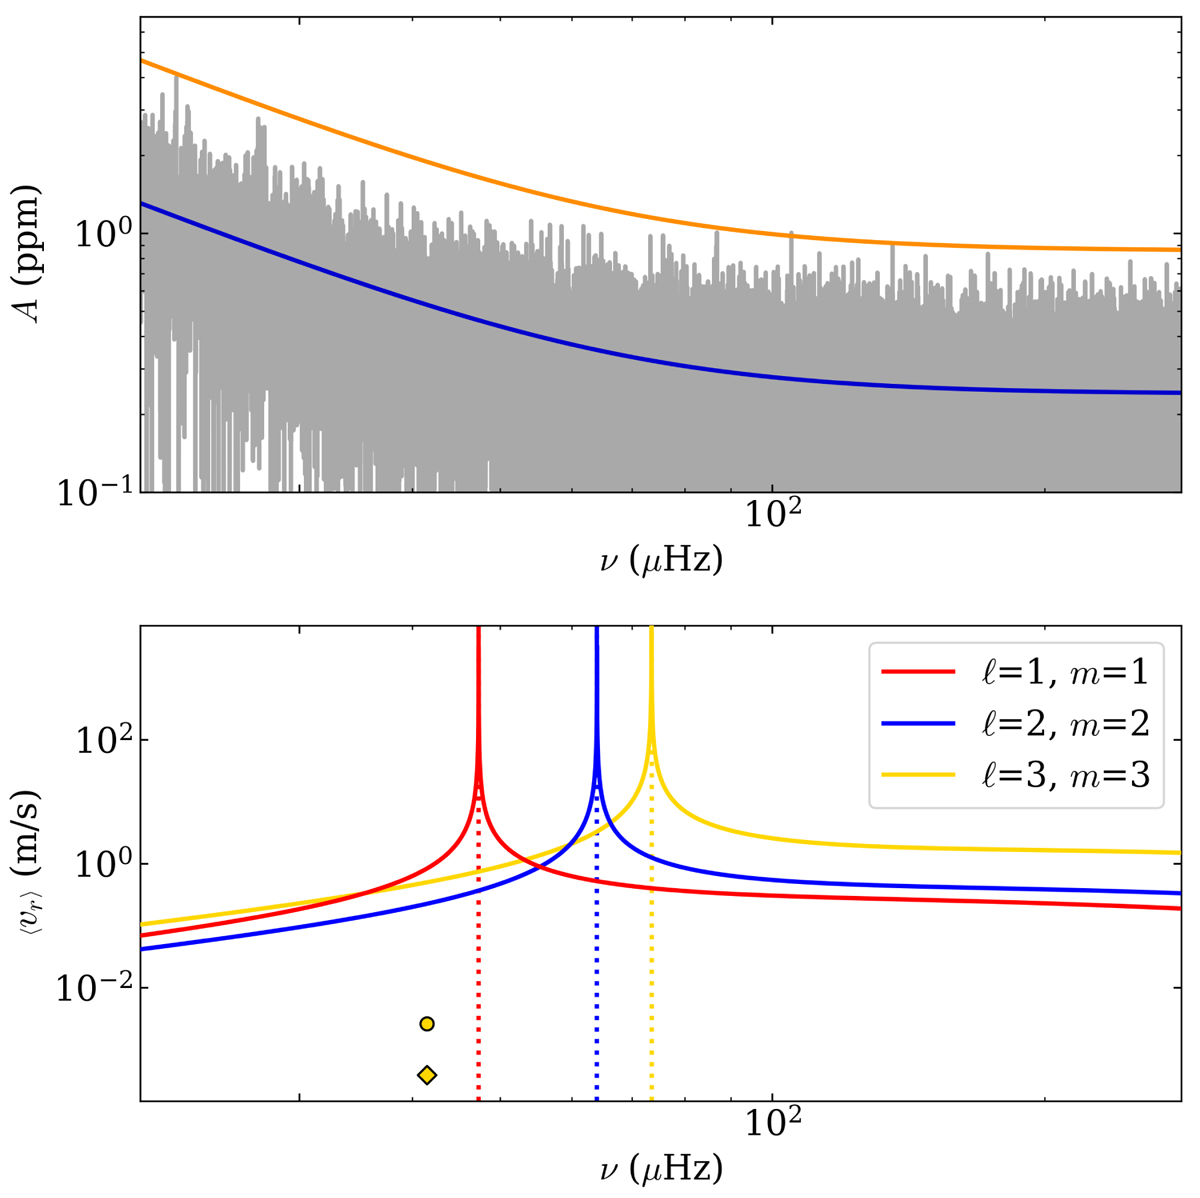
Fig. 17.
Download original image
Example of stellar background and corresponding mode velocity levels required to induce a detectable luminosity fluctuation. Top: power spectrum (grey) of KIC 3733735. The solid blue line corresponds to the B profile. The corresponding significance level computed with Eq. (6) for pdet = 0.1 is shown by the solid orange line. The power spectrum was rescaled from a power spectral density to an amplitude in ppm to simplify the comparison with the luminosity fluctuation level. Bottom: ⟨vr⟩ levels necessary to produce a detectable luminosity fluctuation, assuming the background profiles computed for KIC 3733735, for ℓ = 1, m = 1 (red), ℓ = 2, m = 0 (blue), and ℓ = 3, m = 1 (yellow) modes. In each case, the position of the cancellation frequency νc, ℓ is emphasised by a vertical dotted line of the proper colour. The two yellow symbols correspond to the ⟨vr⟩ obtained for the ℓ = 3 mode with highest amplitude in the 3D hydrodynamical simulations from B22a, that is, at the top of the radiative zone (circle) and close to the top of the simulation domain (diamond), respectively.
Current usage metrics show cumulative count of Article Views (full-text article views including HTML views, PDF and ePub downloads, according to the available data) and Abstracts Views on Vision4Press platform.
Data correspond to usage on the plateform after 2015. The current usage metrics is available 48-96 hours after online publication and is updated daily on week days.
Initial download of the metrics may take a while.