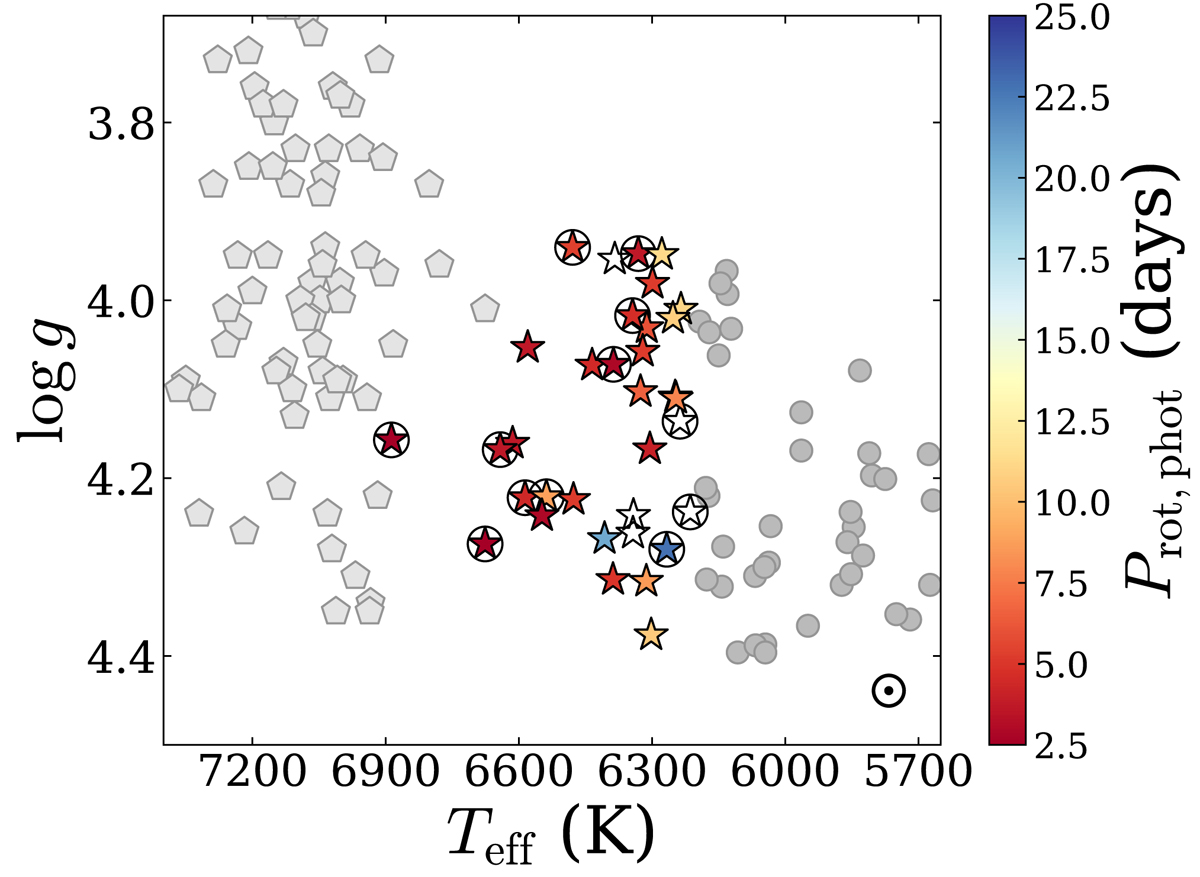
Fig. 1.
Download original image
Teff versus log g diagram for the selected sample (stars), the remaining solar-type pulsators from Lund et al. (2017, grey circles), and the γ Dor sample from Van Reeth et al. (2015b) and Gebruers et al. (2021, grey pentagons). The Sun is represented by the symbol ⊙. The photometric rotation period is colour-coded for the selected sample when available; otherwise the target symbol remains unfilled. The stars for which we obtain a detection with the ensemble analysis described in Sect. 3 are encircled in black.
Current usage metrics show cumulative count of Article Views (full-text article views including HTML views, PDF and ePub downloads, according to the available data) and Abstracts Views on Vision4Press platform.
Data correspond to usage on the plateform after 2015. The current usage metrics is available 48-96 hours after online publication and is updated daily on week days.
Initial download of the metrics may take a while.