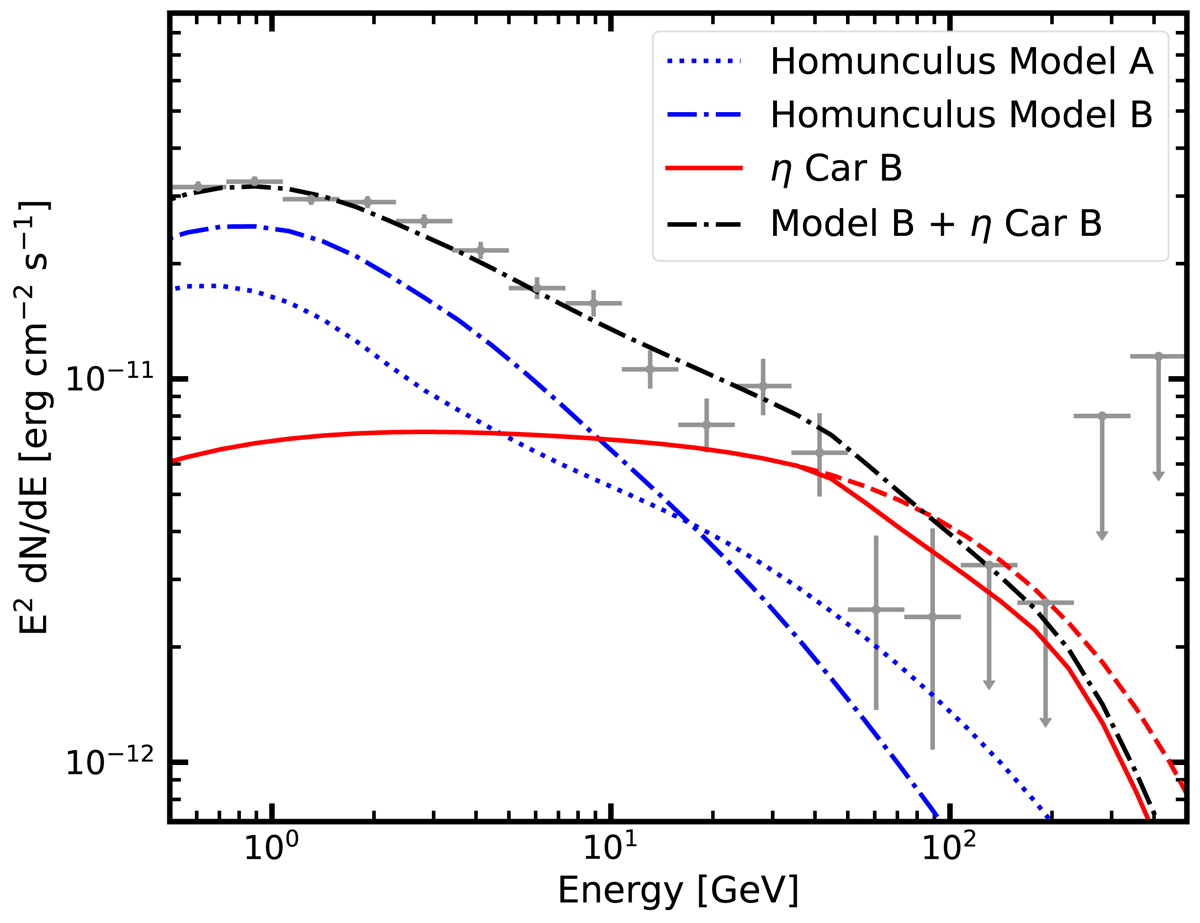
Fig. 4.
Download original image
Model of emission from η Car and the Homunculus together with Fermi-LAT data. The blue curves show emission from the Homunculus for different diffusion properties of the escaping CRs. The dotted curve (Model A) is for D0 = 9 × 1022 cm2 s−1 and α = 0.5. The dashed-dotted curve (Model B) is for D0 = 9 × 1021 cm2 s−1, α = 1, and a factor of 1.1 more escaping CRs compared to the model from W20. The red solid line shows the emission from η Car produced by particles accelerated at the shock towards η Car-B from W20 (the red dashed line is without absorption). The black dashed-dotted curve shows the combined emission from η Car-B and Model B.
Current usage metrics show cumulative count of Article Views (full-text article views including HTML views, PDF and ePub downloads, according to the available data) and Abstracts Views on Vision4Press platform.
Data correspond to usage on the plateform after 2015. The current usage metrics is available 48-96 hours after online publication and is updated daily on week days.
Initial download of the metrics may take a while.