Fig. 2.

Download original image
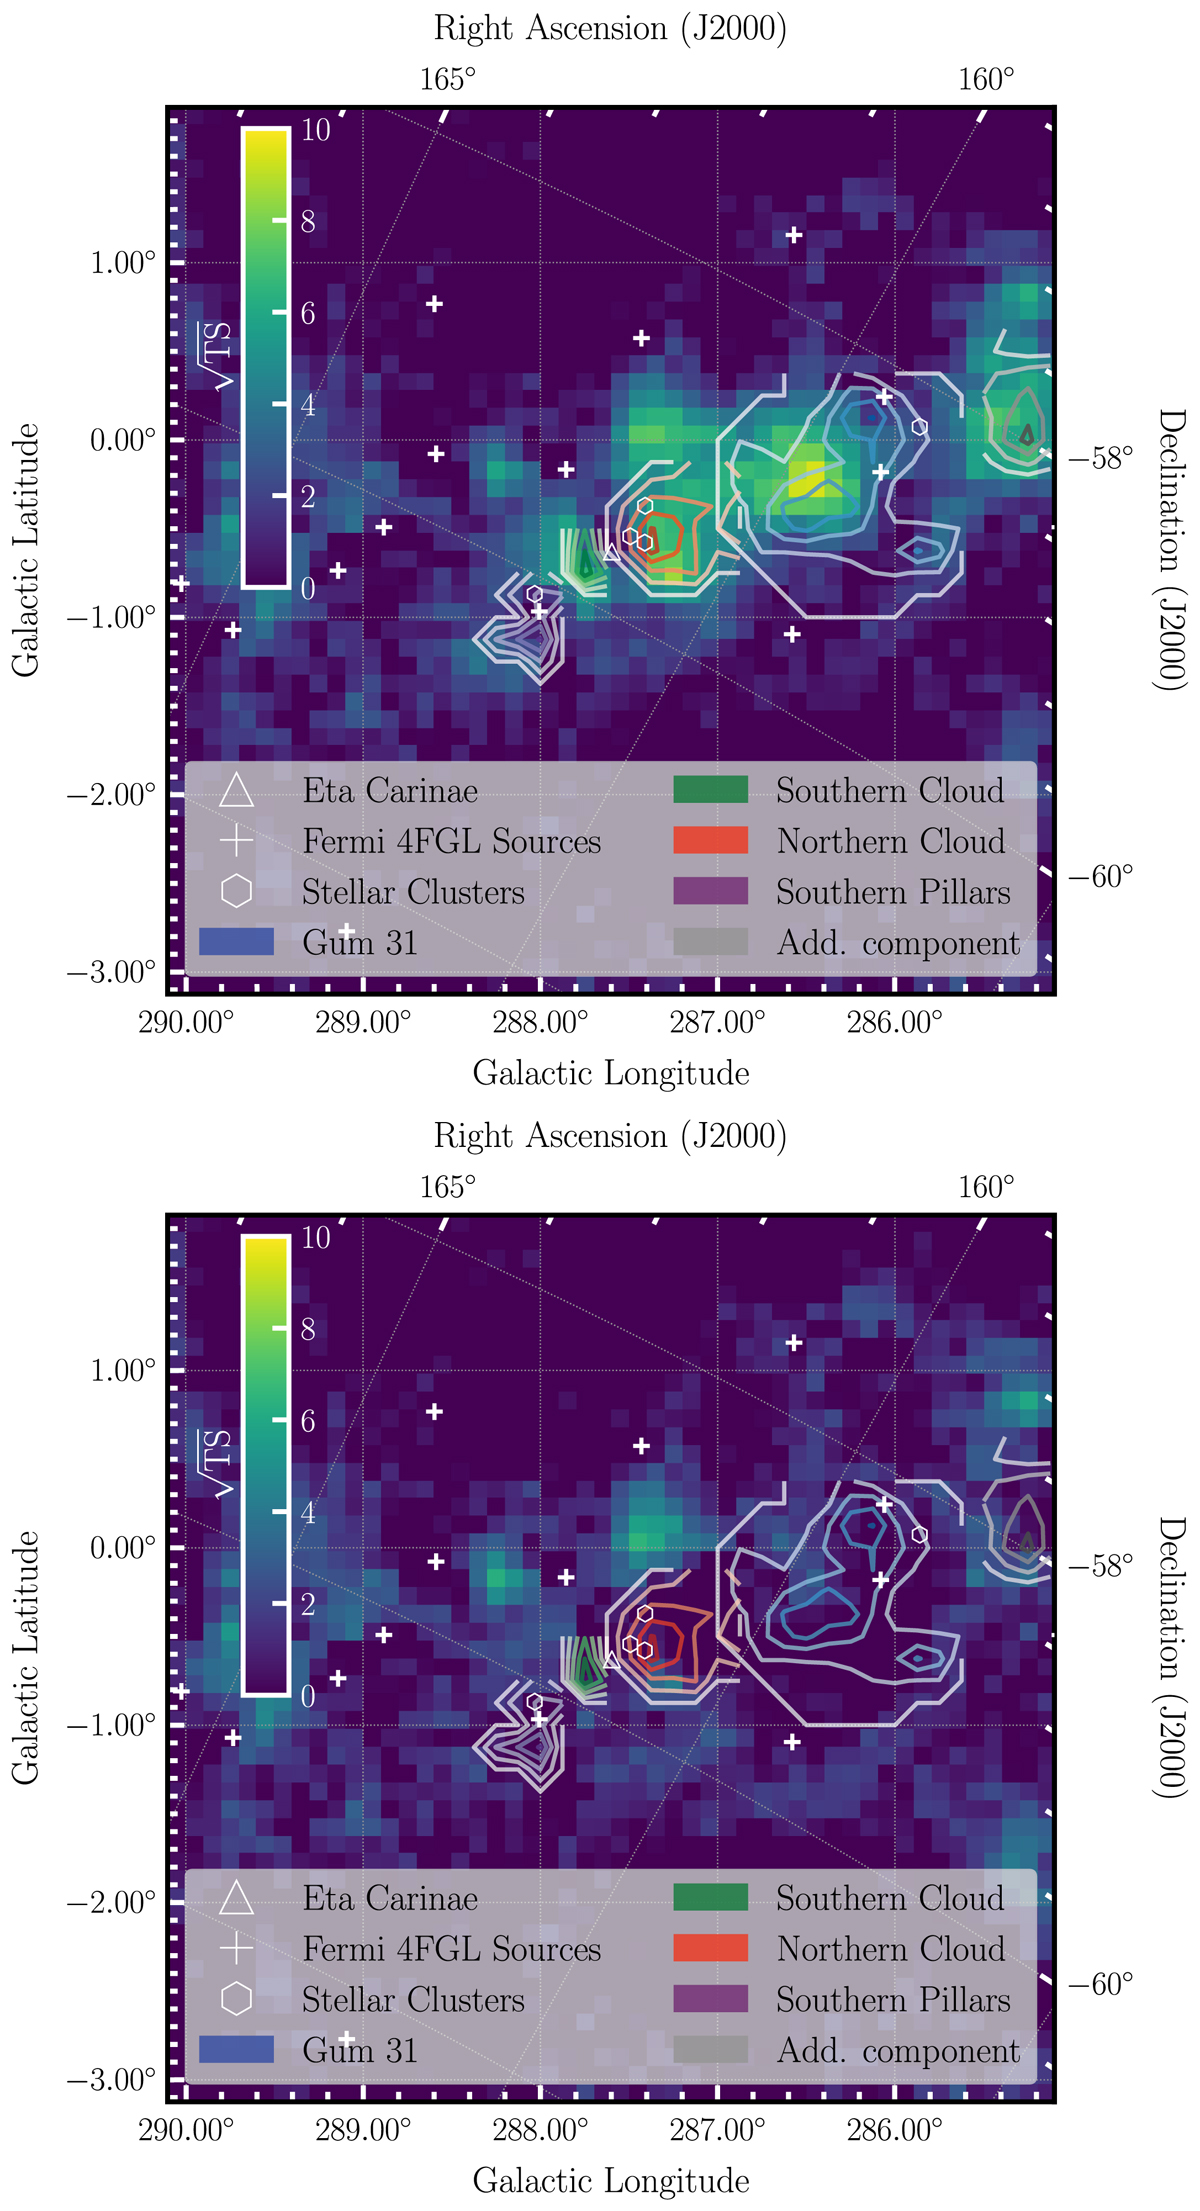
Residual significance maps from the Fermi-LAT analysis in a zoomed region of the ROI. In the upper panel, the ![]() map without the addition of the cloud templates to the model is shown, whereas they are included in the lower panel. In each plot, the cloud templates have overlaid coloured contours indicating the gas density distribution. Additionally, all other 4FGL sources are marked together with massive stellar clusters from Preibisch et al. (2011).
map without the addition of the cloud templates to the model is shown, whereas they are included in the lower panel. In each plot, the cloud templates have overlaid coloured contours indicating the gas density distribution. Additionally, all other 4FGL sources are marked together with massive stellar clusters from Preibisch et al. (2011).
Current usage metrics show cumulative count of Article Views (full-text article views including HTML views, PDF and ePub downloads, according to the available data) and Abstracts Views on Vision4Press platform.
Data correspond to usage on the plateform after 2015. The current usage metrics is available 48-96 hours after online publication and is updated daily on week days.
Initial download of the metrics may take a while.


