Open Access
Fig. 8
Download original image
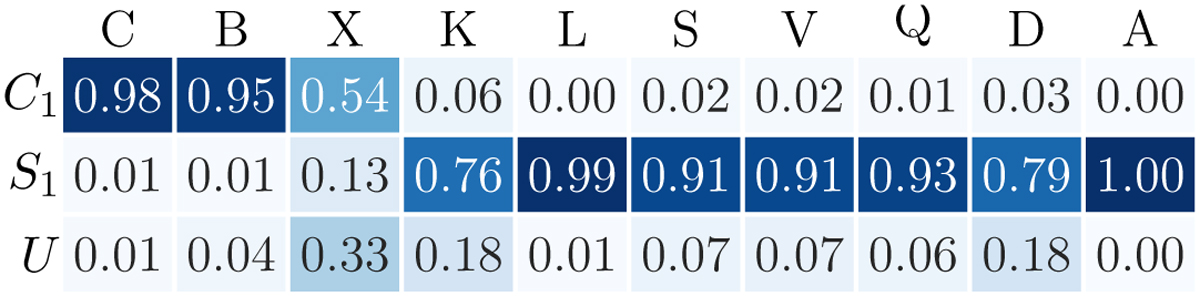
Confusion matrix illustrating the correlation between predicted single-color (g-r) taxonomy outcomes and the results of a three-color taxonomy (g-r, g-i, i-z). This matrix displays the fractions of true positives, false positives, true negatives, and false negatives.
Current usage metrics show cumulative count of Article Views (full-text article views including HTML views, PDF and ePub downloads, according to the available data) and Abstracts Views on Vision4Press platform.
Data correspond to usage on the plateform after 2015. The current usage metrics is available 48-96 hours after online publication and is updated daily on week days.
Initial download of the metrics may take a while.