Open Access
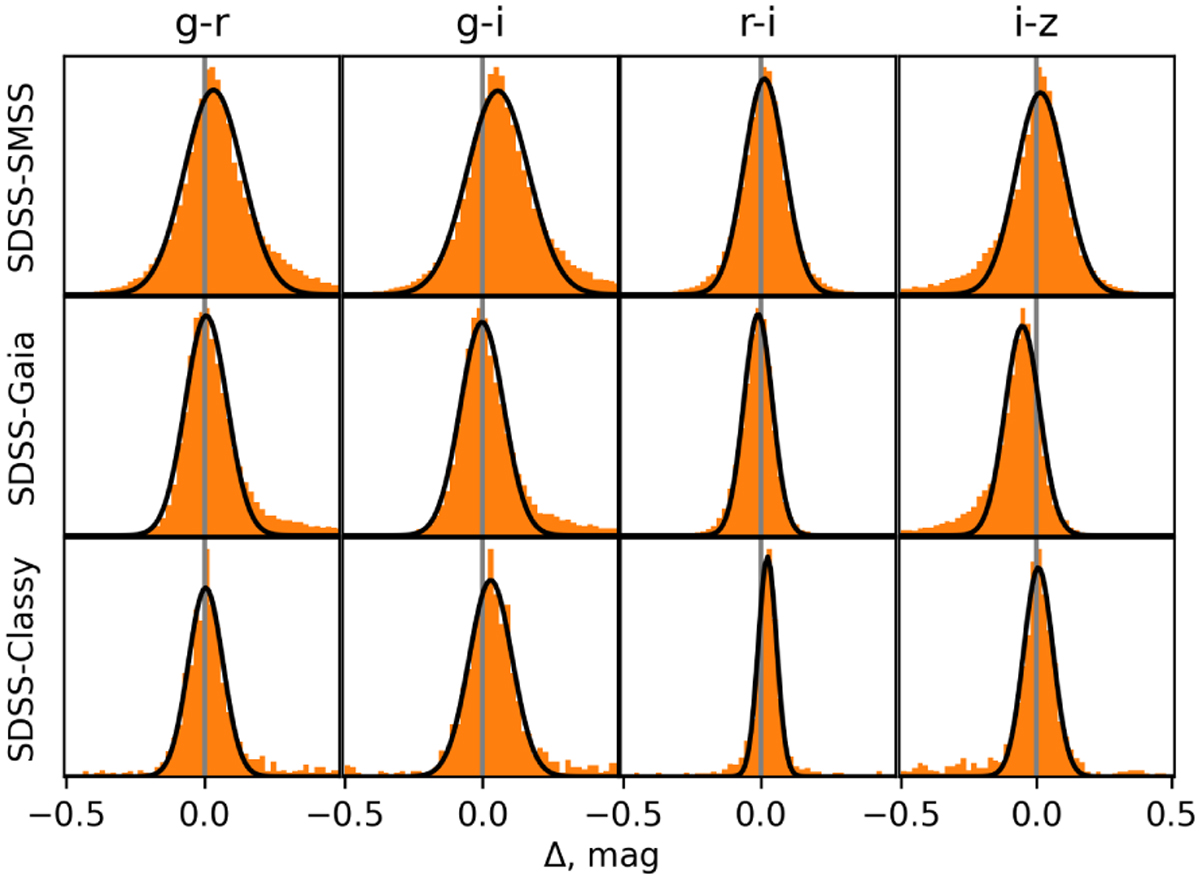
Fig. 2
Download original image
Distribution of color differences between the SMSS, Gaia, and Classy with respect to the SDSS data set, using asteroids commonly found in these data sets. The distribution was fitted with a Gaussian curve, represented by the black line. The central gray vertical line denotes the zero offset.
Current usage metrics show cumulative count of Article Views (full-text article views including HTML views, PDF and ePub downloads, according to the available data) and Abstracts Views on Vision4Press platform.
Data correspond to usage on the plateform after 2015. The current usage metrics is available 48-96 hours after online publication and is updated daily on week days.
Initial download of the metrics may take a while.