Open Access
Fig. 15
Download original image
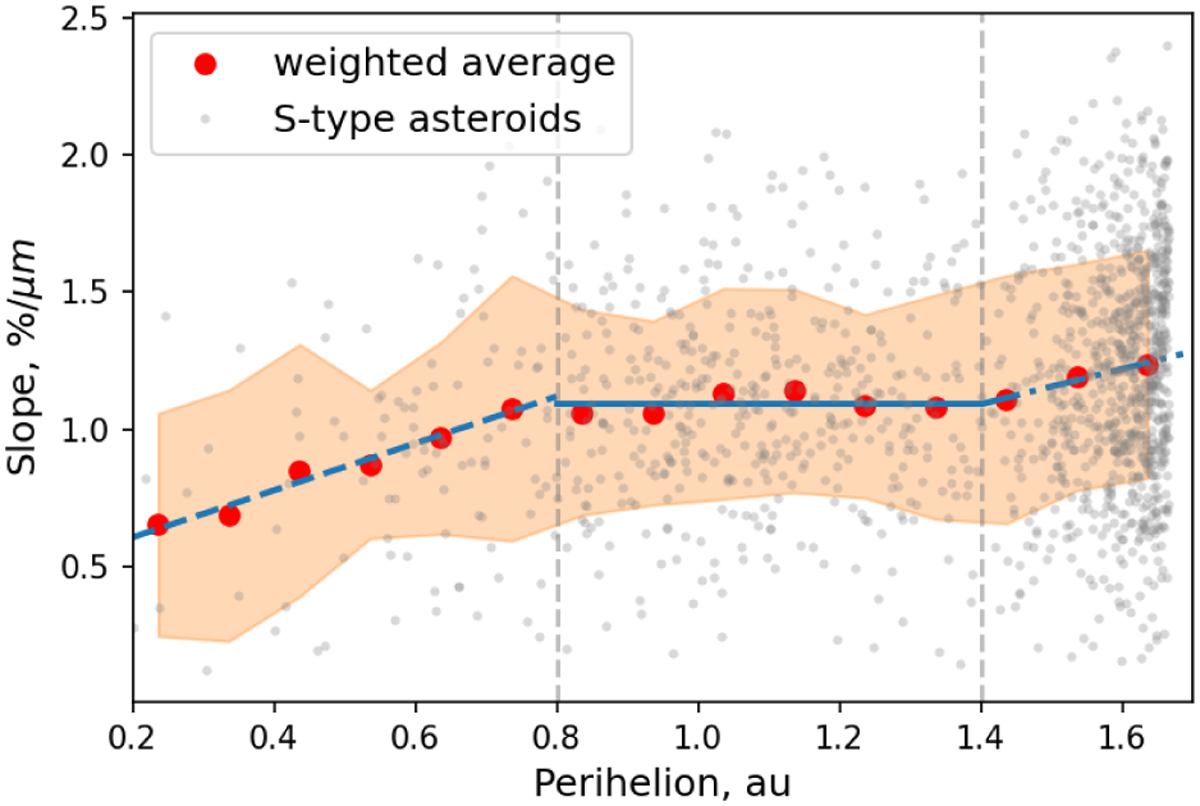
Spectral slope against perihelion for S types. Red dots and the shaded area are the running average and deviation, and blue lines are linear regressions on the running average. Although the entire sample presents a large spread, the running average shows two kinks.
Current usage metrics show cumulative count of Article Views (full-text article views including HTML views, PDF and ePub downloads, according to the available data) and Abstracts Views on Vision4Press platform.
Data correspond to usage on the plateform after 2015. The current usage metrics is available 48-96 hours after online publication and is updated daily on week days.
Initial download of the metrics may take a while.