Fig. 3.
Download original image
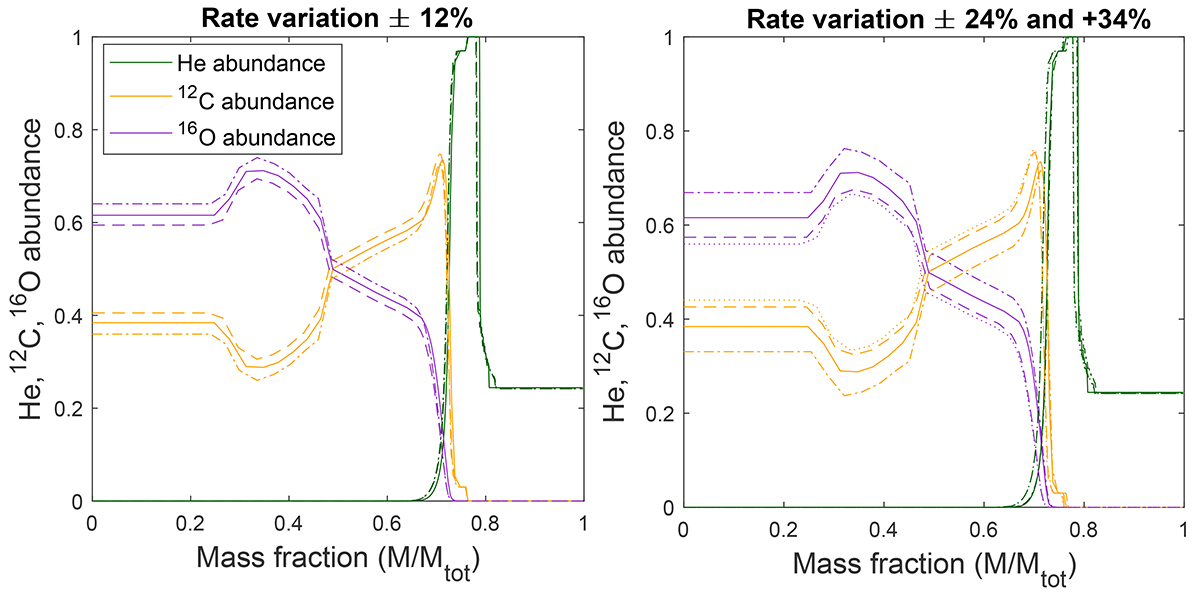
Profiles of 4He, 12C, and 16O abundances at the first thermal pulse as a function of mass fraction. Left: profiles obtained increasing (dashed lines) and decreasing (dot-dashed lines) the 3α reaction rate by 12%. The continuous lines correspond to the data obtained with the standard rate. The green lines represent the abundance of 4He, the orange ones the abundance of 12C, and the purple lines the one of 16O. Right: same as in the left panel, but for a 3α reaction rate variation by ±24% and +34% (dotted lines).
Current usage metrics show cumulative count of Article Views (full-text article views including HTML views, PDF and ePub downloads, according to the available data) and Abstracts Views on Vision4Press platform.
Data correspond to usage on the plateform after 2015. The current usage metrics is available 48-96 hours after online publication and is updated daily on week days.
Initial download of the metrics may take a while.