Fig. 5
Download original image
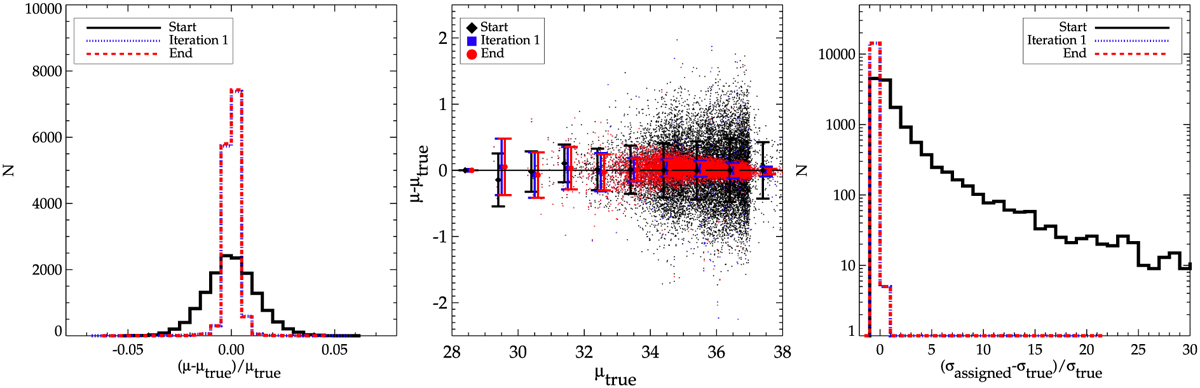
Comparisons of spatial distribution properties in the datasets. Left: histograms of the ratio of the differences between biased (black solid line), after iteration 1 (see text for a definition, blue dotted line), corrected (red dashed line), and true distance moduli to the true distance moduli, namely, the errors in percent on distance moduli. Middle: difference between true and biased (black diamonds), after iteration 1 (blue square) and at the end of the process or corrected (red circles) distance moduli versus true distance moduli. Right: ratio of the difference between assigned uncertainties and true errors to the true errors on distance moduli. Same colors and line styles as the left panel.
Current usage metrics show cumulative count of Article Views (full-text article views including HTML views, PDF and ePub downloads, according to the available data) and Abstracts Views on Vision4Press platform.
Data correspond to usage on the plateform after 2015. The current usage metrics is available 48-96 hours after online publication and is updated daily on week days.
Initial download of the metrics may take a while.