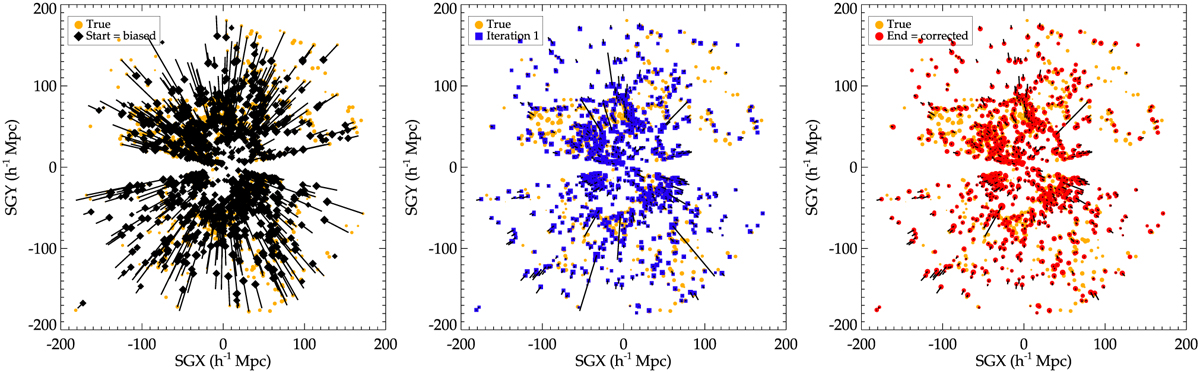
Fig. 4
Download original image
Galaxies in 5 h−1 Mpc thick slices of the XY supergalactic plane. From left to right: black lines show the projected distances between true (yellow filled circles) and biased (black filled diamonds), after nmh. Metropolis Hastings loops but no cooling for the n data points (in the text iteration 1, blue-filled square) and, at the end of all loops (red-filled circles), data point positions. The filled symbol sizes are proportional to velocities in a logarithmic scale. Because errors are large in the left panel, yellow filled circles are harder to distinguish. The algorithm reduces on average errors on data point positions thus on their peculiar velocities, namely, on average, shorter black lines and, by extension, better matching filled symbol sizes of different colors.
Current usage metrics show cumulative count of Article Views (full-text article views including HTML views, PDF and ePub downloads, according to the available data) and Abstracts Views on Vision4Press platform.
Data correspond to usage on the plateform after 2015. The current usage metrics is available 48-96 hours after online publication and is updated daily on week days.
Initial download of the metrics may take a while.