Fig. 18
Download original image
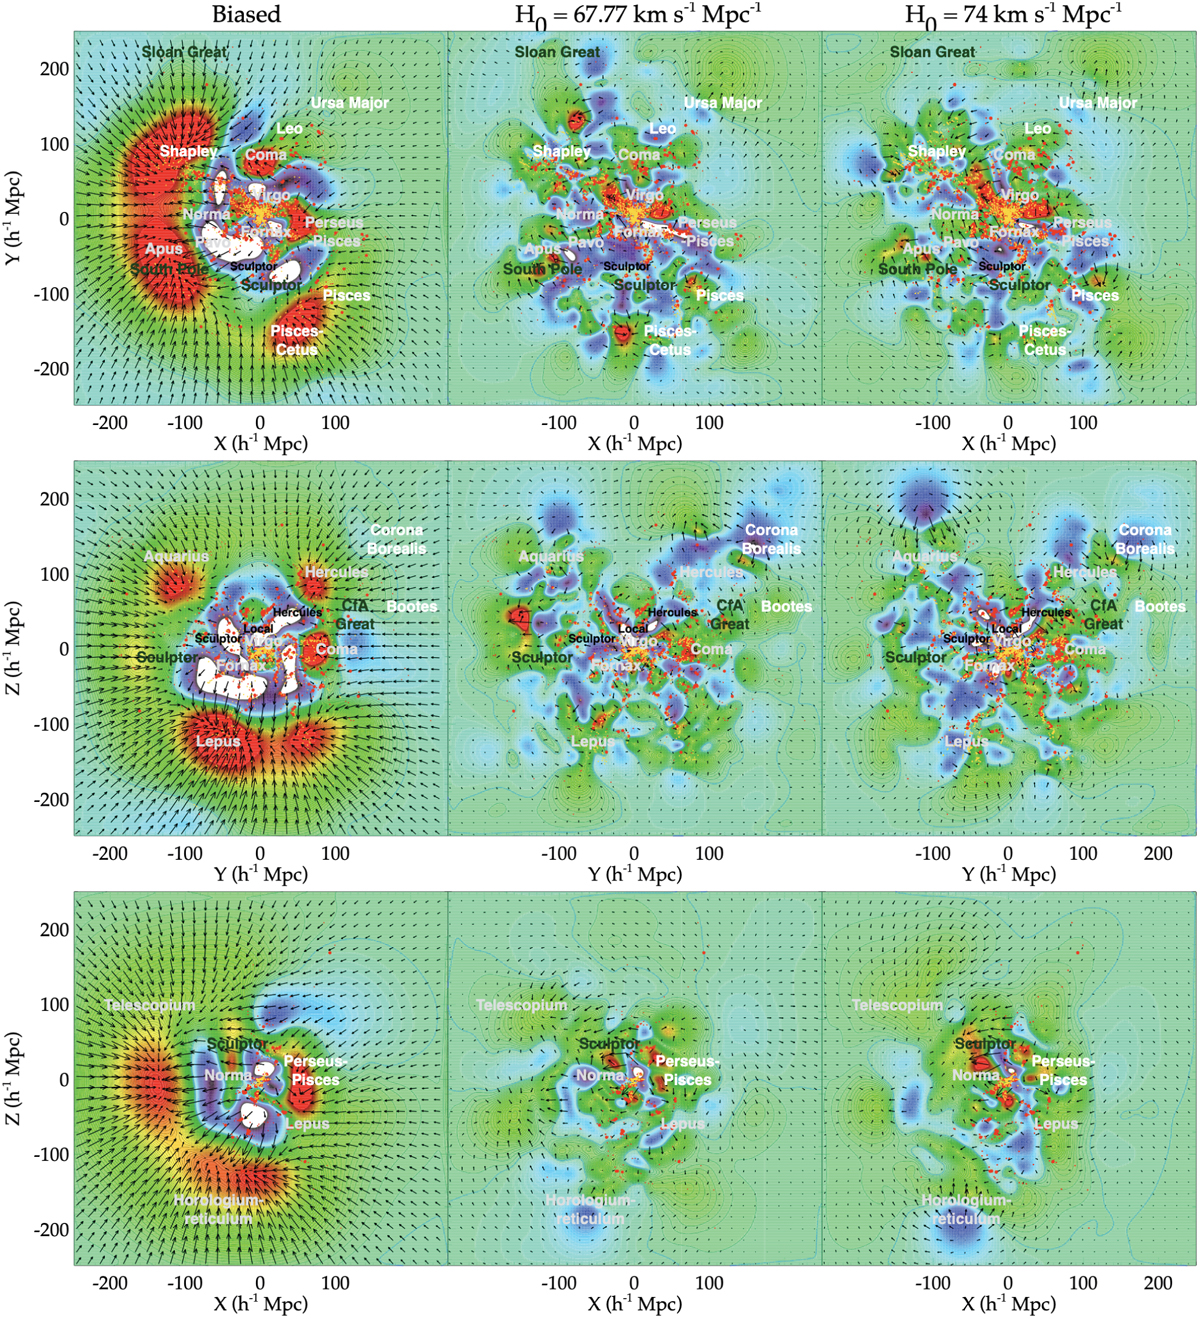
Supergalactic slices of reconstructed density (filled contours) and velocity (arrows) fields of the Local Universe. Hot to cold colors go from over- to under- densities. Red points are galaxies (small filled circles) and groups (larger filled circles) from the 2MRS Galaxy Redshift Catalog for comparison purposes only (2MRS, Huchra et al. 2012; groups from Tempel et al. 2018). Yellow points show galaxies whose peculiar velocities obtained from distance moduli are actually used for the reconstructions. Names indicate superclusters (white), clusters (grey), walls (dark green), and voids (smaller size characters in black). The bias effects are reduced in reconstructed fields obtained with corrected catalogs using either H0 = 67.77 km s−1 Mpc−1 or H0 = 74 km s−1 Mpc−1.
Current usage metrics show cumulative count of Article Views (full-text article views including HTML views, PDF and ePub downloads, according to the available data) and Abstracts Views on Vision4Press platform.
Data correspond to usage on the plateform after 2015. The current usage metrics is available 48-96 hours after online publication and is updated daily on week days.
Initial download of the metrics may take a while.