Fig. 5.
Download original image
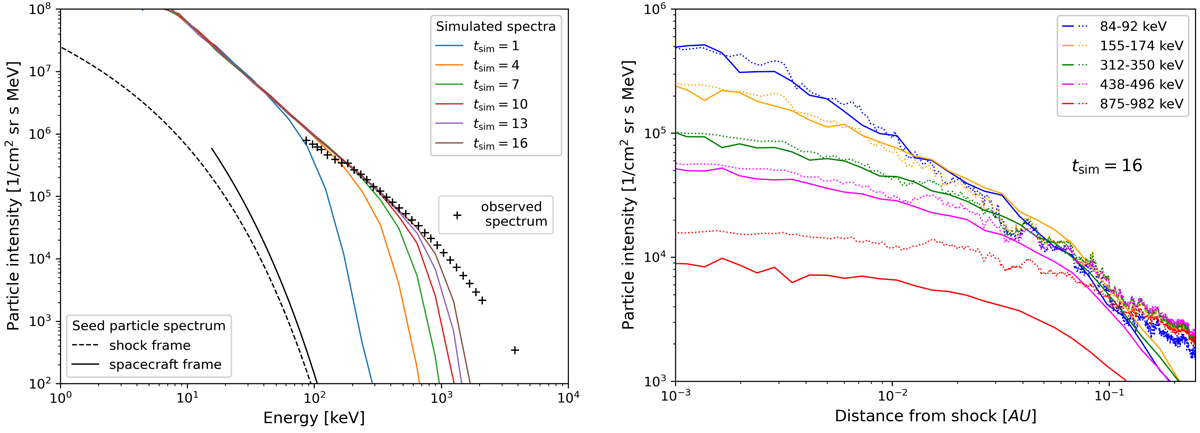
Comparison of simulations with observations. Left panel: time evolution of the proton energy spectrum at the shock in the simulation for ϵinj = 6 × 10⁻³ (colored lines) superposed on the spectrum obtained from the observations (crosses). The indicated simulation times are in arbitrary units. Also shown is the seed particle spectrum as computed in the shock frame (black dashed line) and in the spacecraft frame (solid black line). See the main text for further details. Right panel: simulated proton distributions along the magnetic field line at tsim = 16 [arbitrary units] (solid lines) vs. the distributions obtained from the observations (dotted lines).
Current usage metrics show cumulative count of Article Views (full-text article views including HTML views, PDF and ePub downloads, according to the available data) and Abstracts Views on Vision4Press platform.
Data correspond to usage on the plateform after 2015. The current usage metrics is available 48-96 hours after online publication and is updated daily on week days.
Initial download of the metrics may take a while.