Fig. 3
Download original image
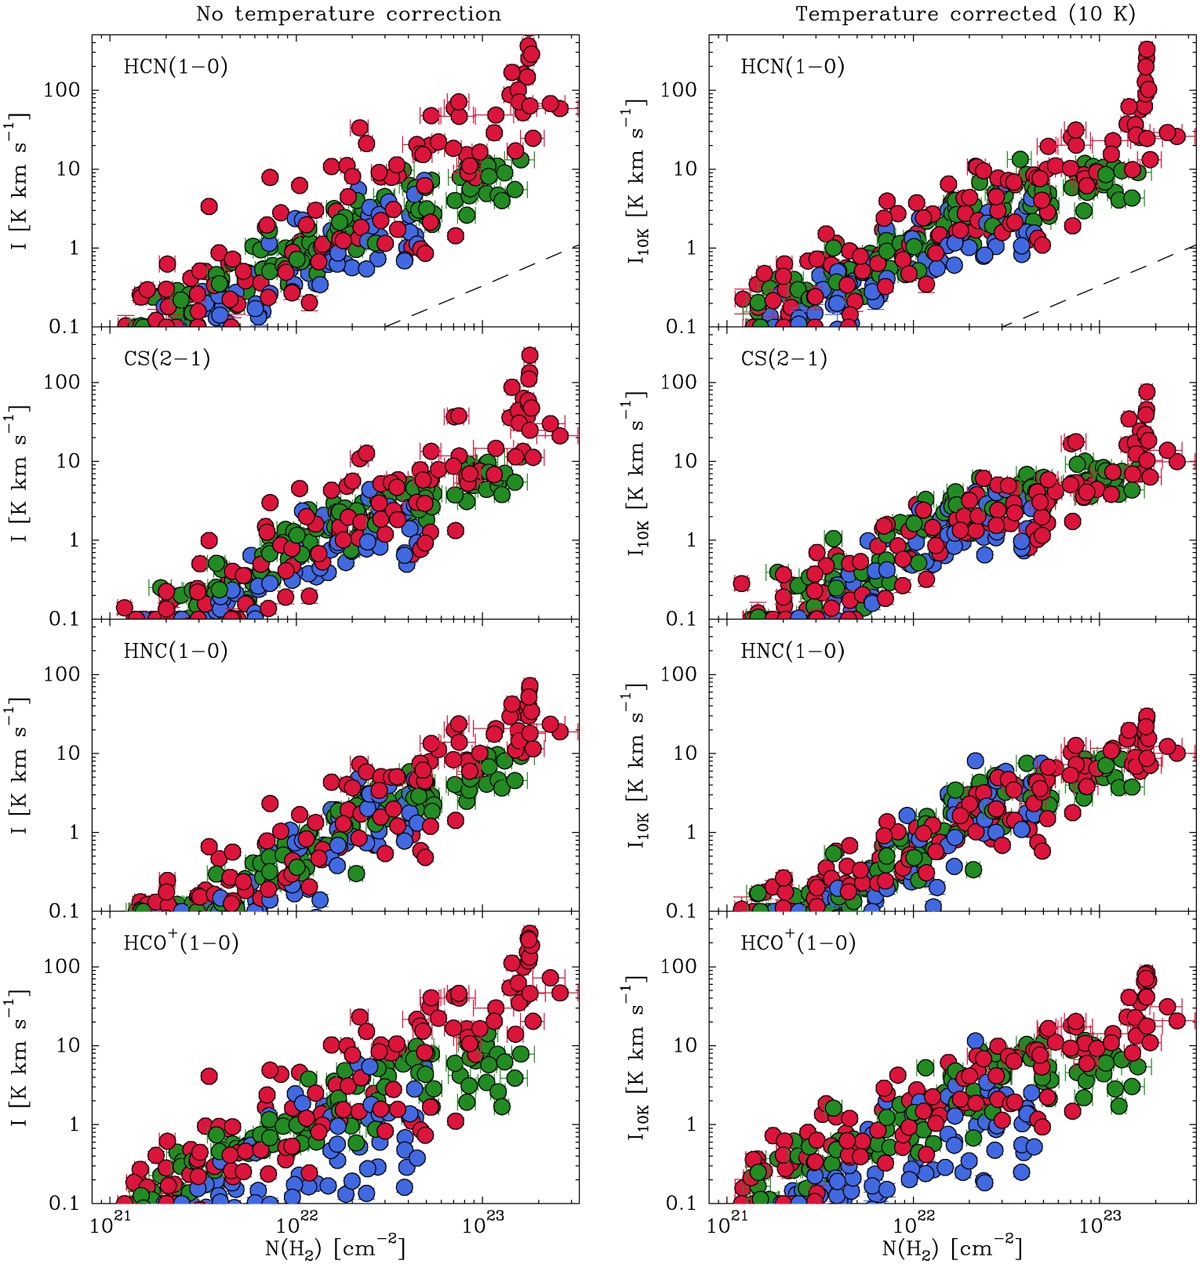
Velocity-integrated intensities of the traditional dense-gas tracers HCN(1−0), CS(2−1), HNC(1−0), and HCO+ (1−0) as a function of H2 column density. Left panels: original uncorrected data. Right panels: data after applying the correction factors described in Appendix D.2 to simulate emission at a constant temperature of 10 K. Note the decrease in dispersion and the better agreement between clouds after the temperature correction. The data are color-coded as in previous figures: blue for California, green for Perseus, and red for Orion A. The dashed line in the top panels represents a linear trend for comparison.
Current usage metrics show cumulative count of Article Views (full-text article views including HTML views, PDF and ePub downloads, according to the available data) and Abstracts Views on Vision4Press platform.
Data correspond to usage on the plateform after 2015. The current usage metrics is available 48-96 hours after online publication and is updated daily on week days.
Initial download of the metrics may take a while.