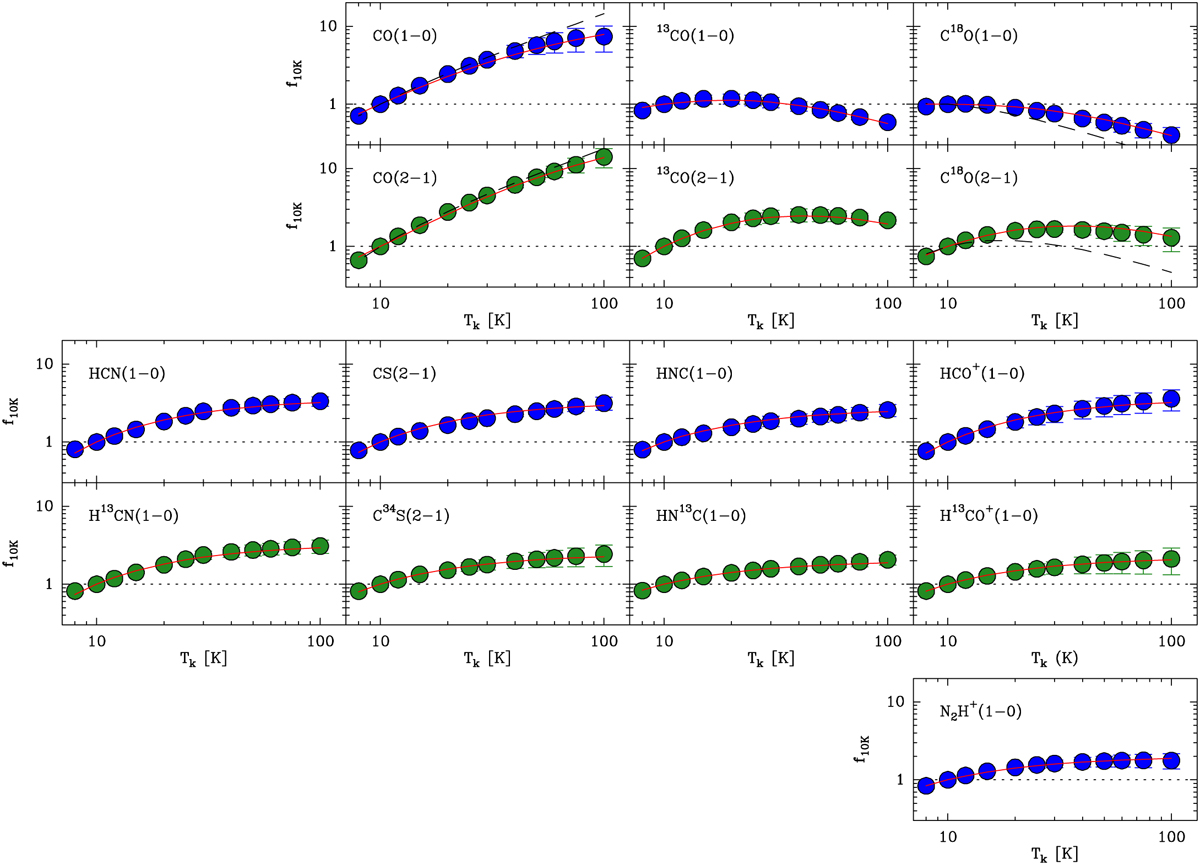
Fig. D.3
Download original image
Intensity predictions of the observed lines as a function of gas temperature normalized to their value at 10 K. The intensities have been calculated by running the model of the Perseus cloud presented in Paper I for 12 different gas temperatures. For each temperature, six different H2 column densities in the range 2 × 10²¹ to 2 × 1023 cm−2 have been assumed, and each circle represents the intensity average with an error bar that indicates the 1σ dispersion (and is often smaller than the marker size). The upper block of panels contains the CO isotopologs, the middle block contains the traditional dense-gas tracers and their isotopologs, and the bottom panel contains N2H+(1−0). The solid red lines represent the empirical fits described in the text and used in the analysis to correct for gas temperature variations. The dashed black; lines in the CO and C18O panels represent the optically thick and thin LTE solutions discussed in the text.
Current usage metrics show cumulative count of Article Views (full-text article views including HTML views, PDF and ePub downloads, according to the available data) and Abstracts Views on Vision4Press platform.
Data correspond to usage on the plateform after 2015. The current usage metrics is available 48-96 hours after online publication and is updated daily on week days.
Initial download of the metrics may take a while.