Fig. D.1
Download original image
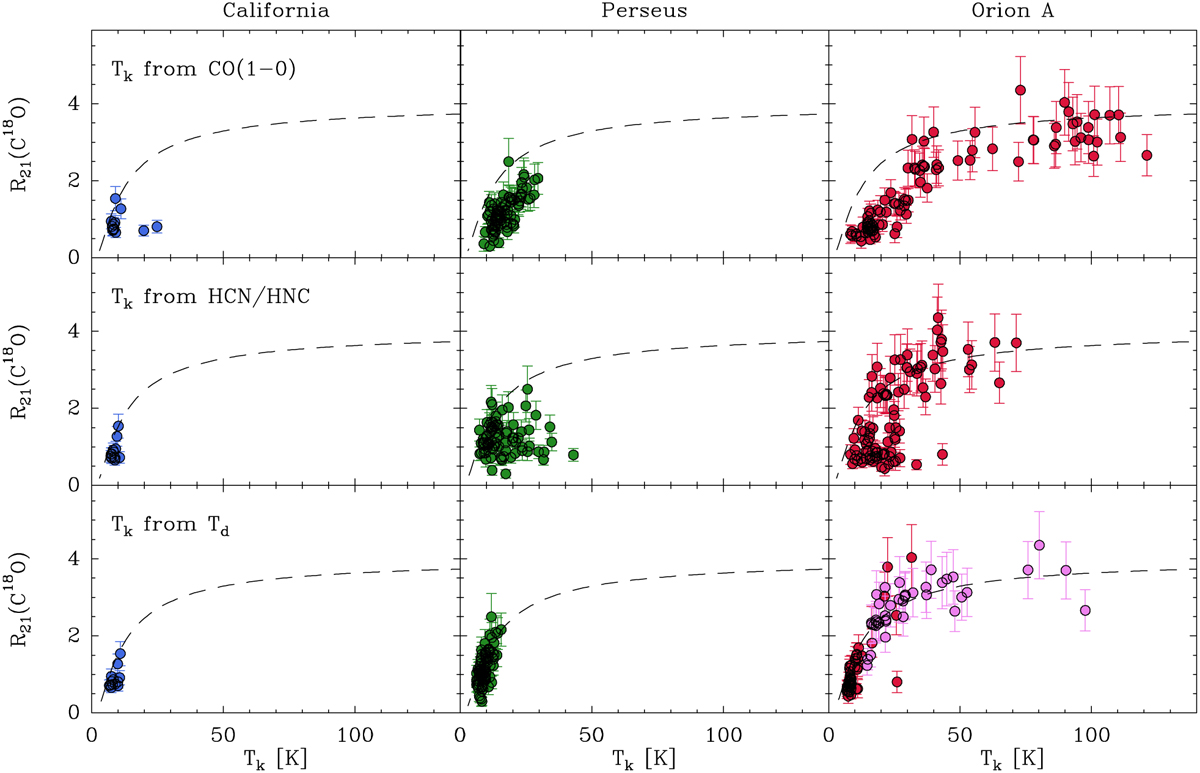
C18O(2−1)/C18O(1−0) intensity ratio as a function of the gas temperature determined using three different methods: peak of the 12CO(1−0) line (top), HCN(1−0)/HNC(1−0) line ratio method of Hacar et al. (2020) (middle), and the empirical fit based on the dust temperature described in the text (bottom). The data are color-coded as in Fig. 1, and the purple points in the bottom-right panel indicate the Orion A positions where the NH3-based temperature estimate of Friesen et al. (2017) has been used. The dashed lines represent the expected line ratio under optically thin LTE conditions, and the ability of the data to match this curve reflects the quality of the temperature determination.
Current usage metrics show cumulative count of Article Views (full-text article views including HTML views, PDF and ePub downloads, according to the available data) and Abstracts Views on Vision4Press platform.
Data correspond to usage on the plateform after 2015. The current usage metrics is available 48-96 hours after online publication and is updated daily on week days.
Initial download of the metrics may take a while.