Fig. A.2
Download original image
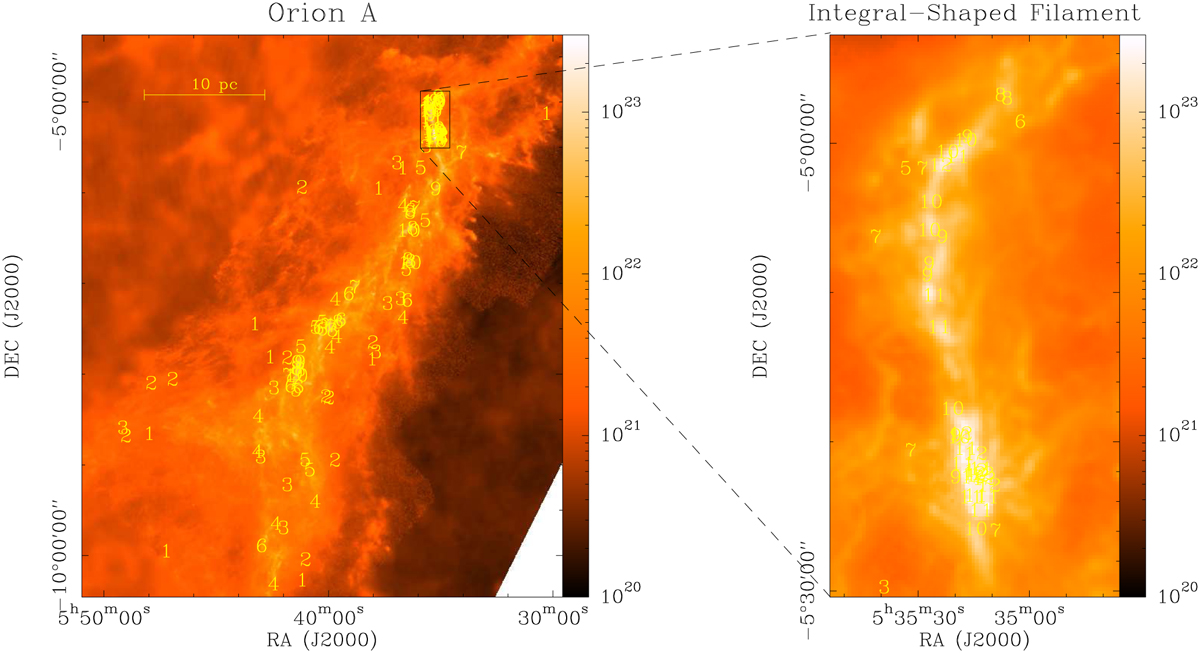
Sampling of the Orion A cloud. The color images represent the distribution of column density as derived by Lombardi et al. (2014) from Herschel Space Observatory data, and the numbers indicate the positions chosen using stratified random sampling. The right panel is an expanded view of the ISF, which contains some of the highest column density positions. The numbers refer to the column density bin of the position (1 is lowest and 12 is highest), the 10 pc scale bar assumes a distance of 432 pc (Zucker et al. 2019), and the wedge scale is in units of cm−2.
Current usage metrics show cumulative count of Article Views (full-text article views including HTML views, PDF and ePub downloads, according to the available data) and Abstracts Views on Vision4Press platform.
Data correspond to usage on the plateform after 2015. The current usage metrics is available 48-96 hours after online publication and is updated daily on week days.
Initial download of the metrics may take a while.