Open Access
Fig. 5
Download original image
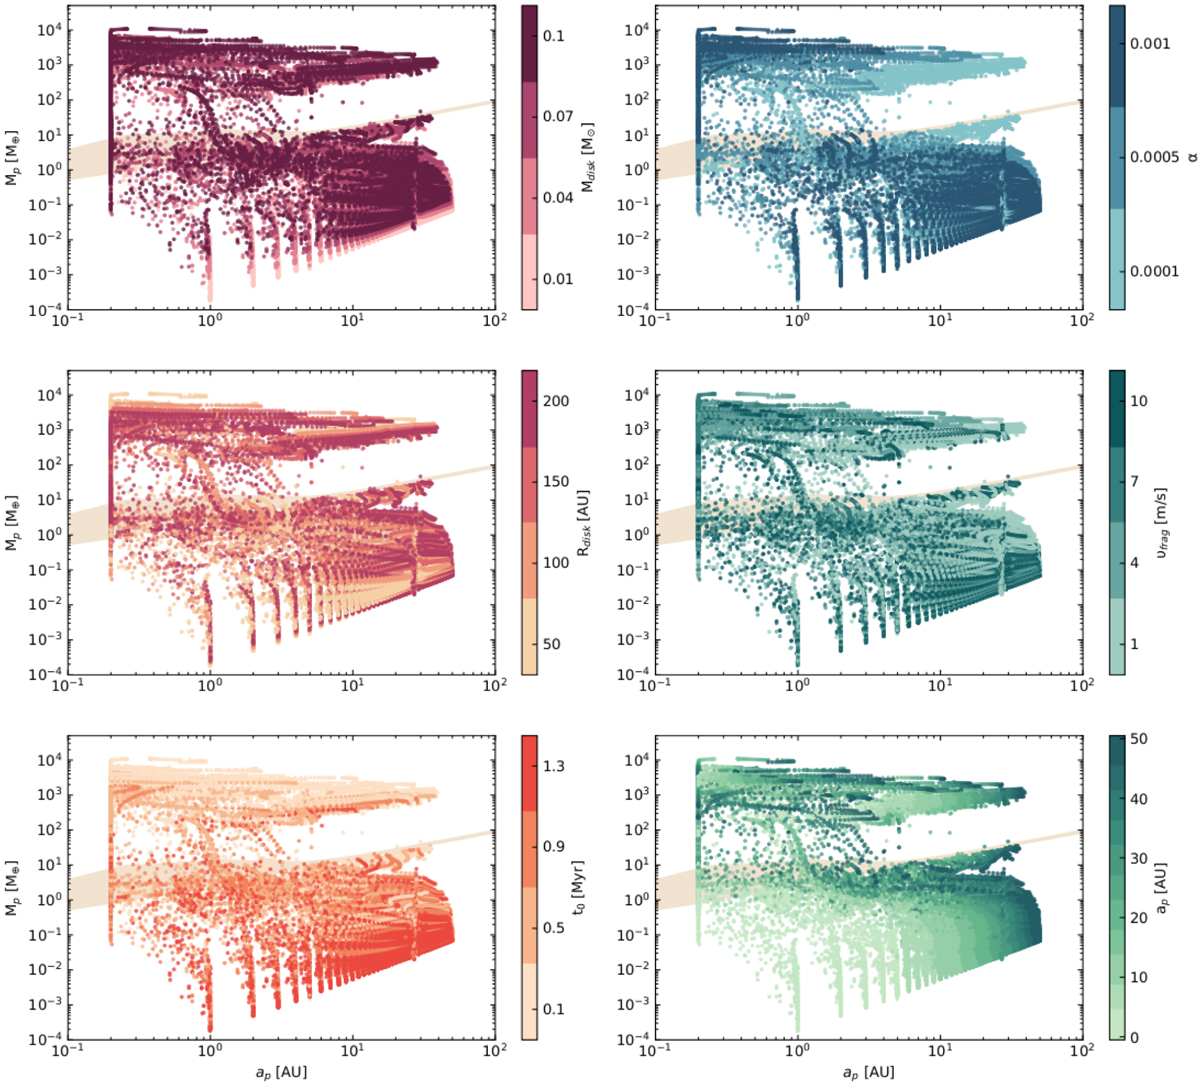
Final planetary masses and final positions for all simulations with fDG = 0.015. The color-coding in each plot represents the different initial conditions tested for the corresponding parameter. The beige area shows the range of the initial pebble isolation masses, as calculated by the disk properties.
Current usage metrics show cumulative count of Article Views (full-text article views including HTML views, PDF and ePub downloads, according to the available data) and Abstracts Views on Vision4Press platform.
Data correspond to usage on the plateform after 2015. The current usage metrics is available 48-96 hours after online publication and is updated daily on week days.
Initial download of the metrics may take a while.