Fig. 1
Download original image
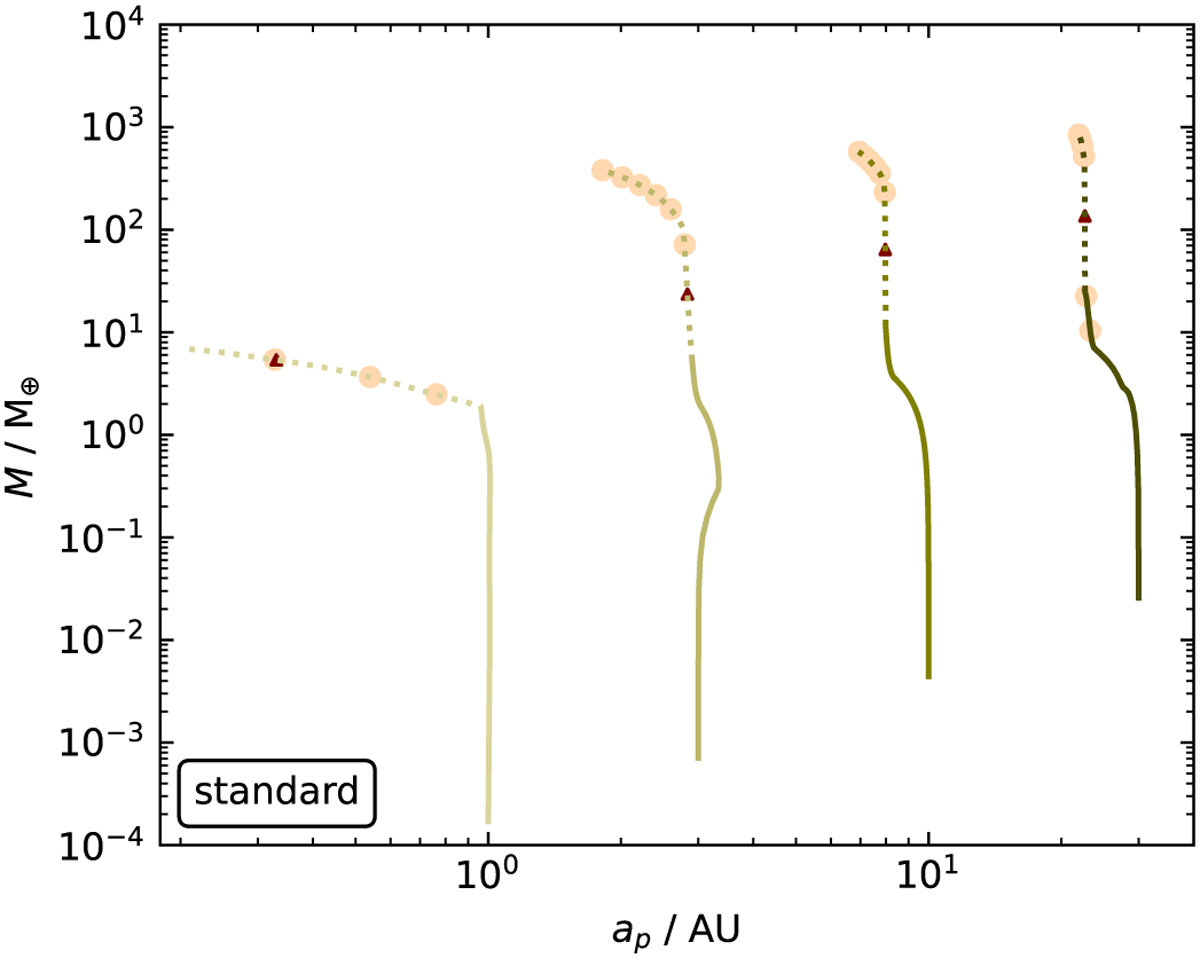
Evolution of planetary mass as a function of position using the standard set of parameters (highlighted in bold in Table 1). The dots mark time steps of 0.5 Myr after the embryos start growing unless the planet has reached the inner edge, in which case they are omitted. The solid lines represent pebble accretion, while the dashed lines represent gas accretion. The triangles mark the transition from type-I to type-II migration.
Current usage metrics show cumulative count of Article Views (full-text article views including HTML views, PDF and ePub downloads, according to the available data) and Abstracts Views on Vision4Press platform.
Data correspond to usage on the plateform after 2015. The current usage metrics is available 48-96 hours after online publication and is updated daily on week days.
Initial download of the metrics may take a while.