Open Access
Fig. 3
Download original image
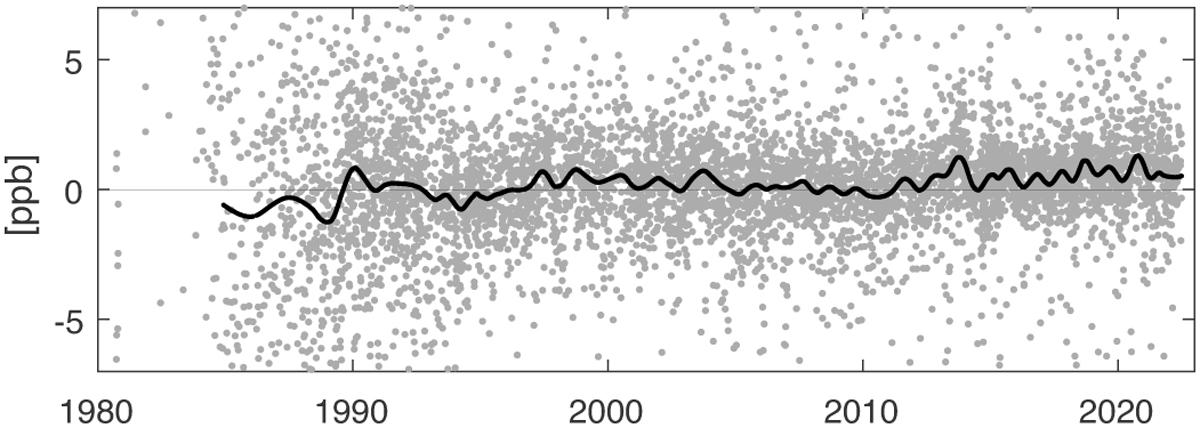
Session-wise scale factor computed with VIE2022b parametrization with respect to ITRF2020. The black line represents the smoothed scale factor obtained by local regression using a span of 5% of the total number of data points.
Current usage metrics show cumulative count of Article Views (full-text article views including HTML views, PDF and ePub downloads, according to the available data) and Abstracts Views on Vision4Press platform.
Data correspond to usage on the plateform after 2015. The current usage metrics is available 48-96 hours after online publication and is updated daily on week days.
Initial download of the metrics may take a while.