Open Access
Fig. 10
Download original image
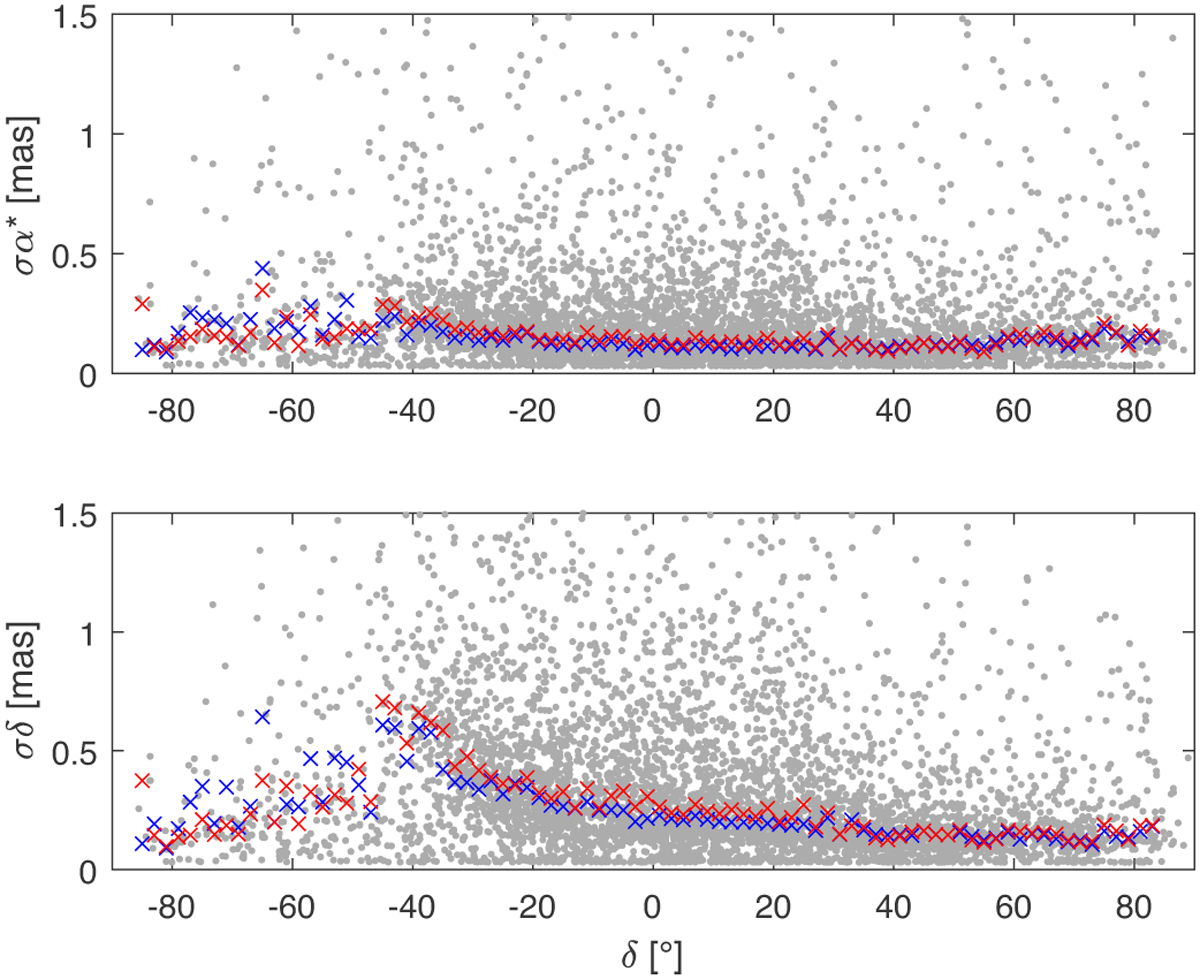
VIE2022b-sx formal errors (gray dots) in α* (upper plot) and δ (lower plot) with respect to declination. Crosses depict median formal errors computed over 2° declination in red for VIE2022b-sx and in blue for ICRF3.
Current usage metrics show cumulative count of Article Views (full-text article views including HTML views, PDF and ePub downloads, according to the available data) and Abstracts Views on Vision4Press platform.
Data correspond to usage on the plateform after 2015. The current usage metrics is available 48-96 hours after online publication and is updated daily on week days.
Initial download of the metrics may take a while.