Fig. 6.
Download original image
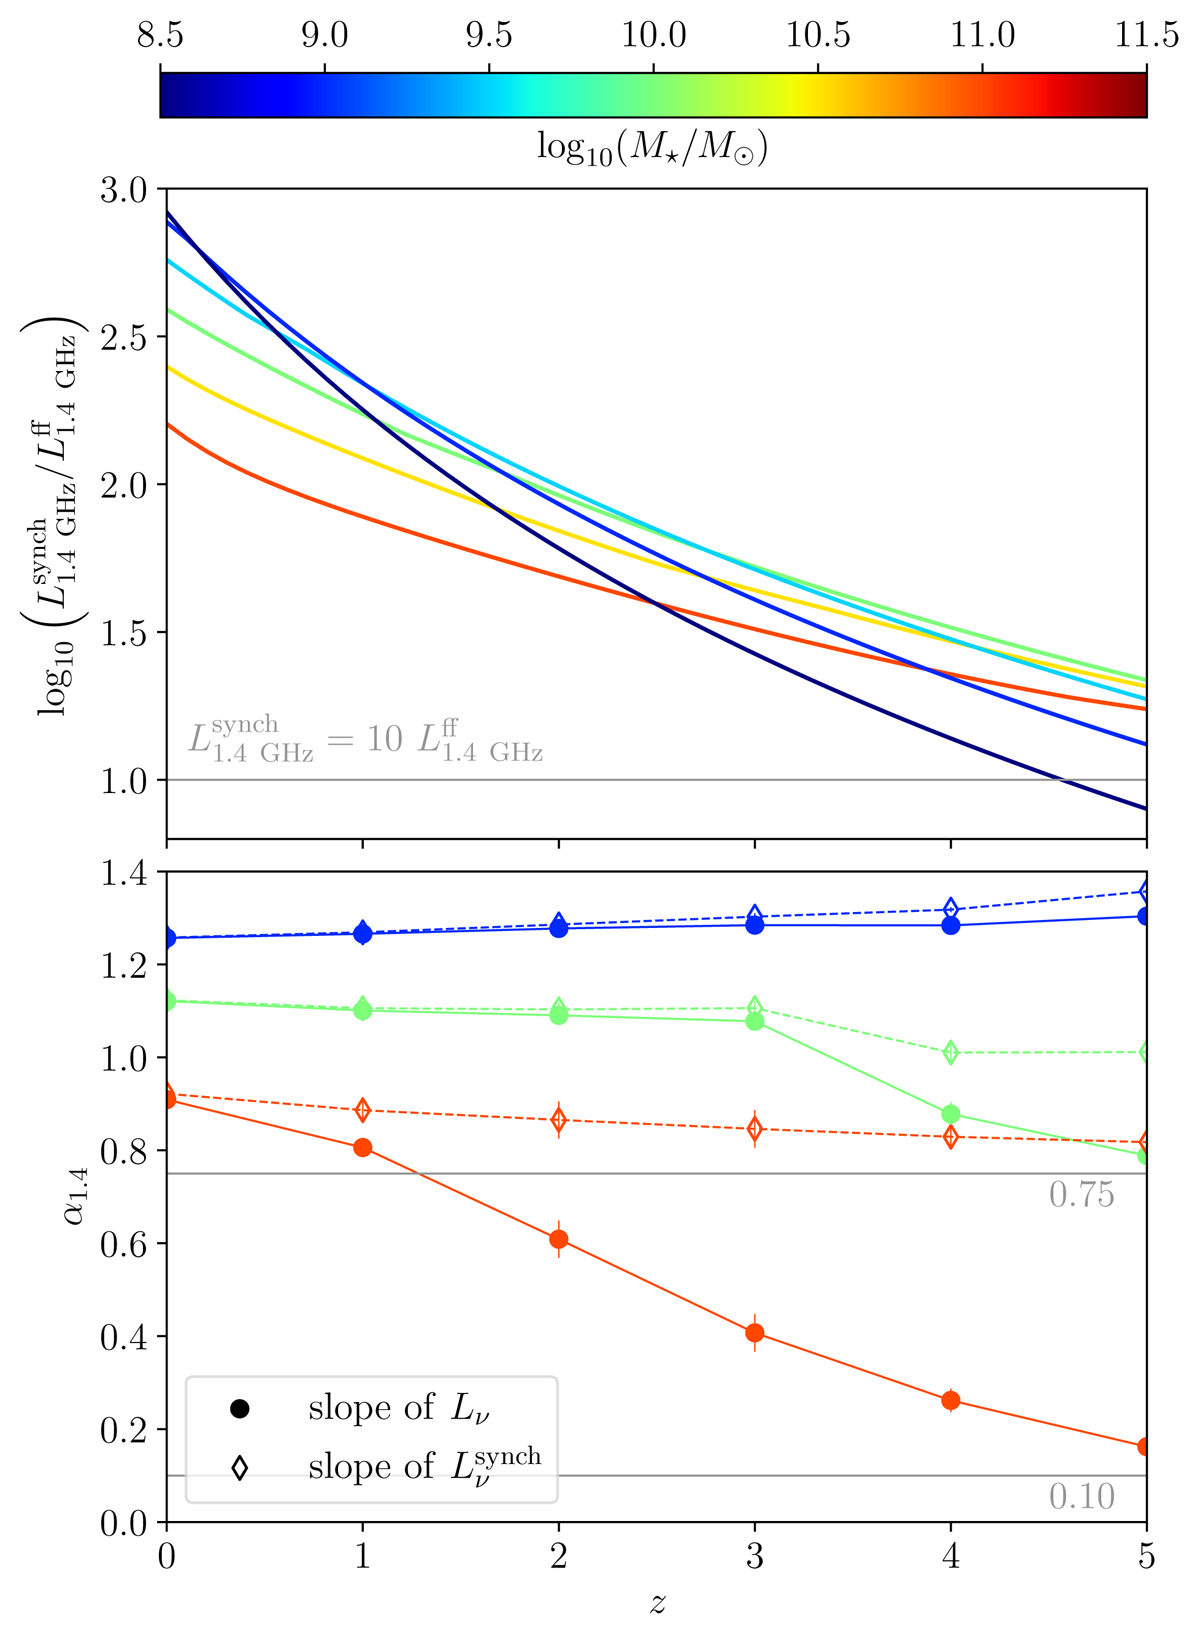
Analysis of radio spectra at ν = 1.4 GHz. The top panel shows the ratio of non-thermal (![]() ) and thermal emission (
) and thermal emission (![]() ) as a function of redshift. The gray horizontal line indicates a thermal fraction of 10% which is typically observed in local galaxies. The bottom panel shows the result of a fit of the total radio luminosity (Lν) and the synchrotron component (
) as a function of redshift. The gray horizontal line indicates a thermal fraction of 10% which is typically observed in local galaxies. The bottom panel shows the result of a fit of the total radio luminosity (Lν) and the synchrotron component (![]() ) to a function f(ν)∝ν−α1.4. The fit is performed around ν = 1.4 GHz.
) to a function f(ν)∝ν−α1.4. The fit is performed around ν = 1.4 GHz.
Current usage metrics show cumulative count of Article Views (full-text article views including HTML views, PDF and ePub downloads, according to the available data) and Abstracts Views on Vision4Press platform.
Data correspond to usage on the plateform after 2015. The current usage metrics is available 48-96 hours after online publication and is updated daily on week days.
Initial download of the metrics may take a while.