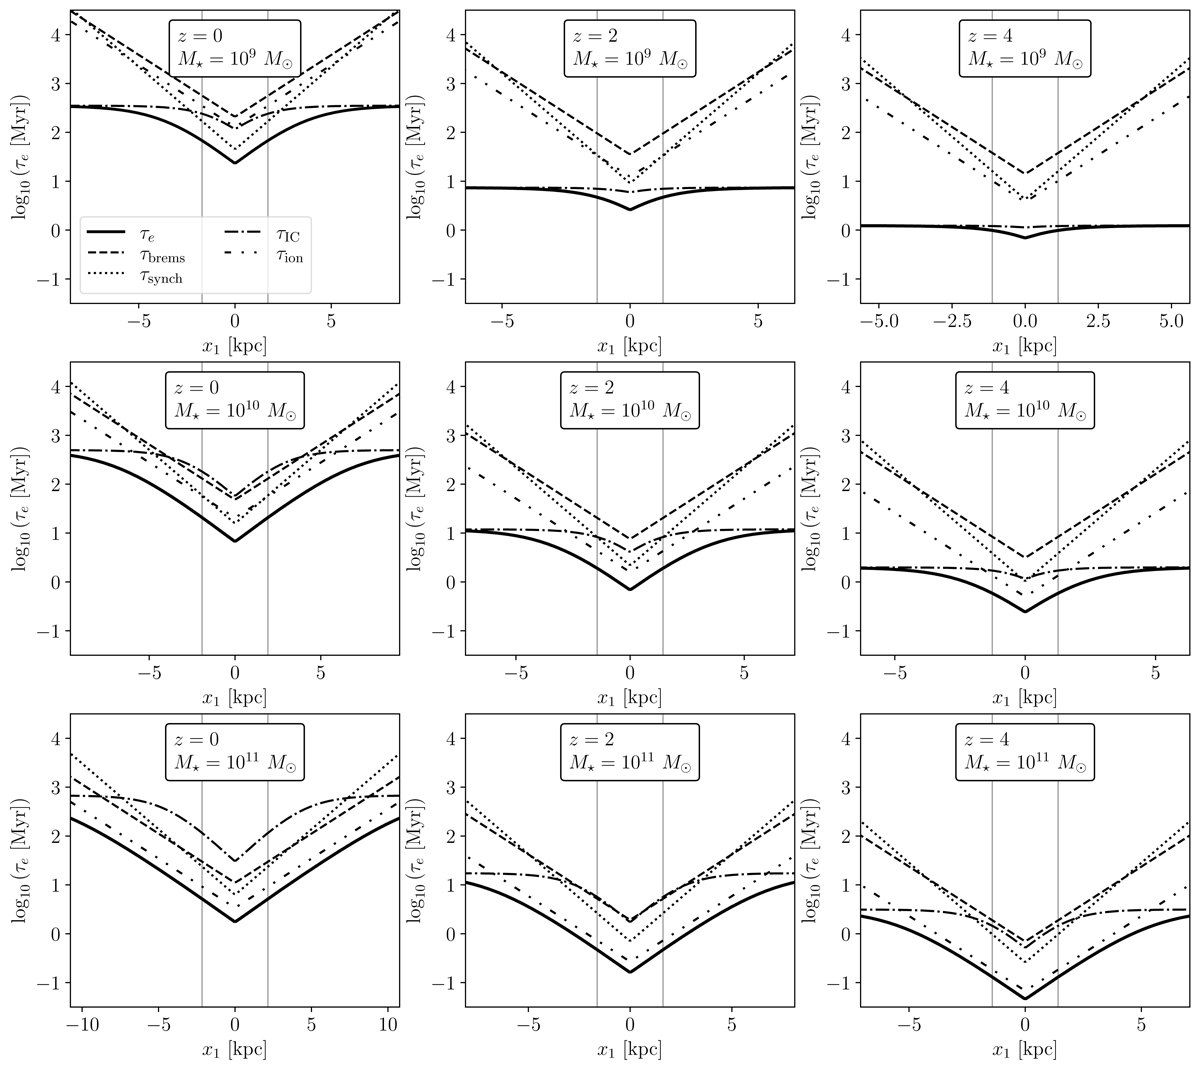
Fig. 4.
Download original image
Cooling timescales of CR electrons in a slice through the center of galaxies with different stellar masses, M⋆, (top to bottom panels) and different redshifts, z (left to right panels). The value of γe used in this plot corresponds to the one at which CR electrons contribute mostly to the synchrotron emission at 1.4 GHz, i.e., at which νc = νobs = 1.4 GHz; see Eq. (32). The total timescale, τe, (solid lines) has contributions from bremsstrahlung (τbrems, dashed lines), synchrotron losses (τsynch, dotted lines), inverse Compton losses (τIC, dashed-dotted lines), and ionization losses (τion, dashed-dotted-dotted lines). Grey vertical lines indicate the characteristic radius Rgal, i.e., they enclose 2Rgal.
Current usage metrics show cumulative count of Article Views (full-text article views including HTML views, PDF and ePub downloads, according to the available data) and Abstracts Views on Vision4Press platform.
Data correspond to usage on the plateform after 2015. The current usage metrics is available 48-96 hours after online publication and is updated daily on week days.
Initial download of the metrics may take a while.