Fig. 7
Download original image
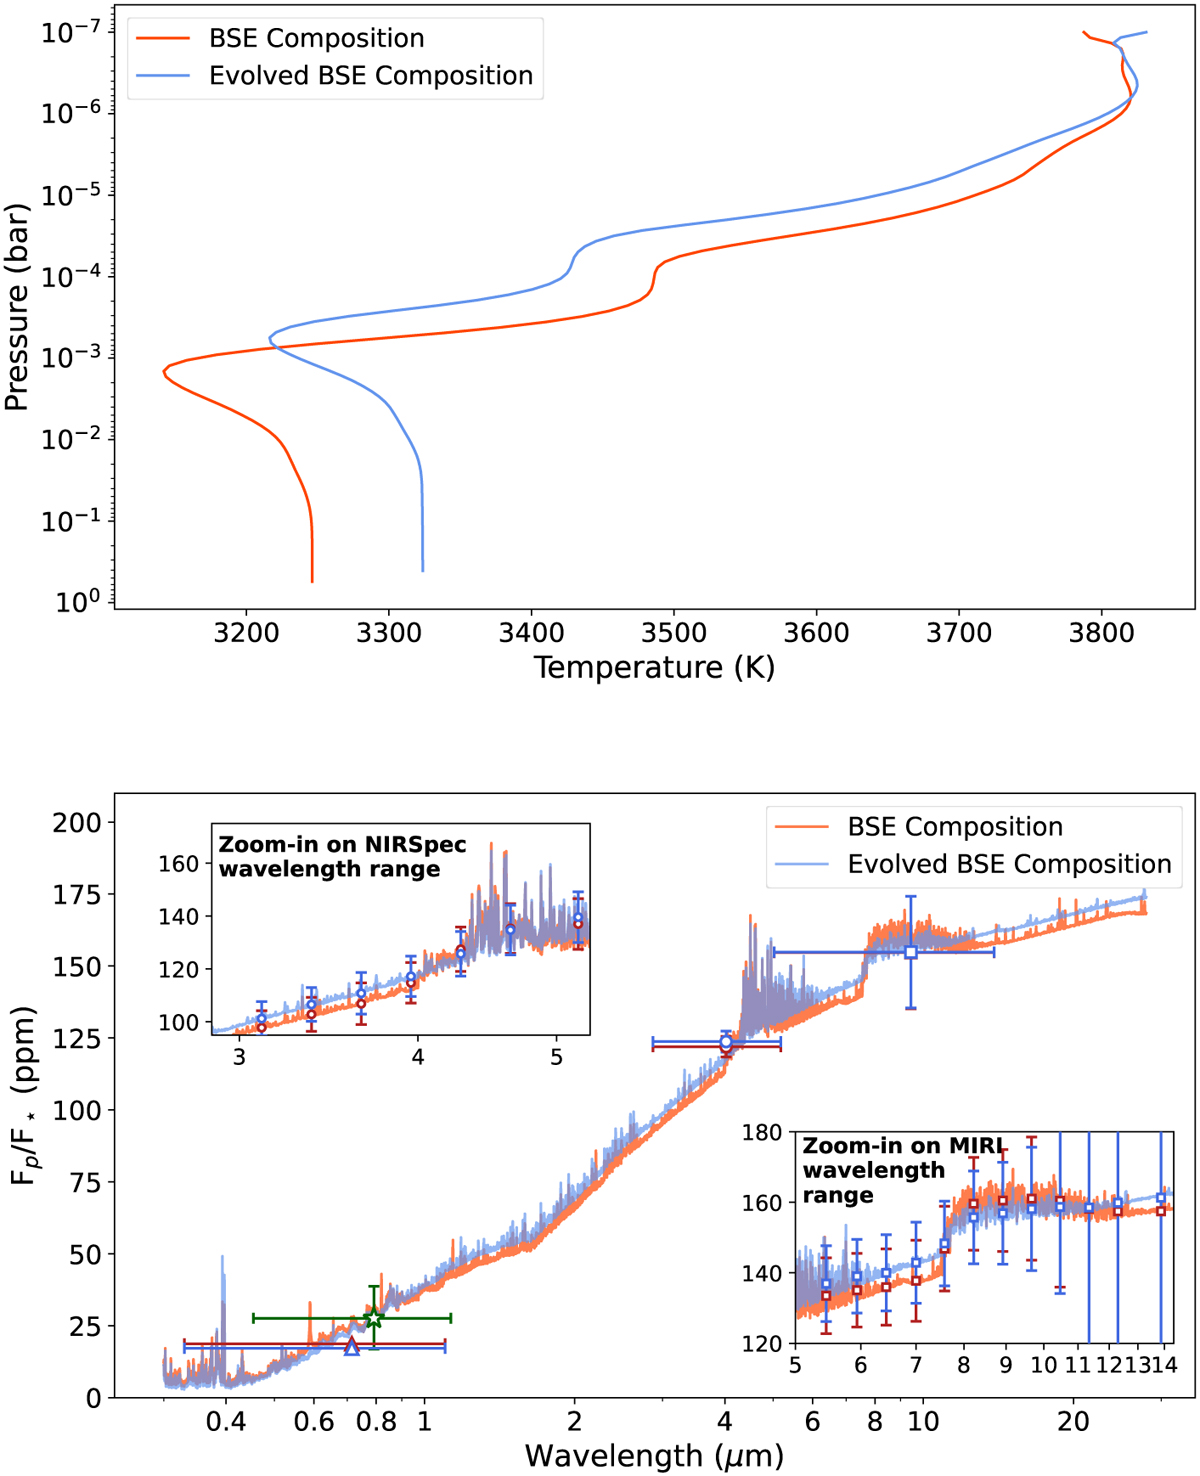
Theoretical models of outgassed atmosphere of TOI-561 b. Top panel, a: Temperature-pressure profile of the planet for a bulk silicate Earth (BSE) composition (in orange) and an evolved BSE composition (in blue). Bottom panel, b: Theoretical emission spectra for BSE (orange curve) and evolved BSE (blue curve) composition. The TESS observation of the eclipse depth is shown as a green star, where the error bars on the wavelength axis show the extent of the TESS bandpass. Other data points are simulated observations for NIRSpec (circles), MIRI (squares), and CHEOPS (triangles) for both models (represented by the colours). The white-light eclipse depths are shown for NIRSpec and MIRI with errors showing their wavelength coverage. The two insets show the zoomed-in versions of the main plot for the NIRSpec and MIRI wavelength ranges. The spectroscopic simulated eclipse depths (at R = 7) are also shown for both instruments in these plots.
Current usage metrics show cumulative count of Article Views (full-text article views including HTML views, PDF and ePub downloads, according to the available data) and Abstracts Views on Vision4Press platform.
Data correspond to usage on the plateform after 2015. The current usage metrics is available 48-96 hours after online publication and is updated daily on week days.
Initial download of the metrics may take a while.