Fig. 7
Download original image
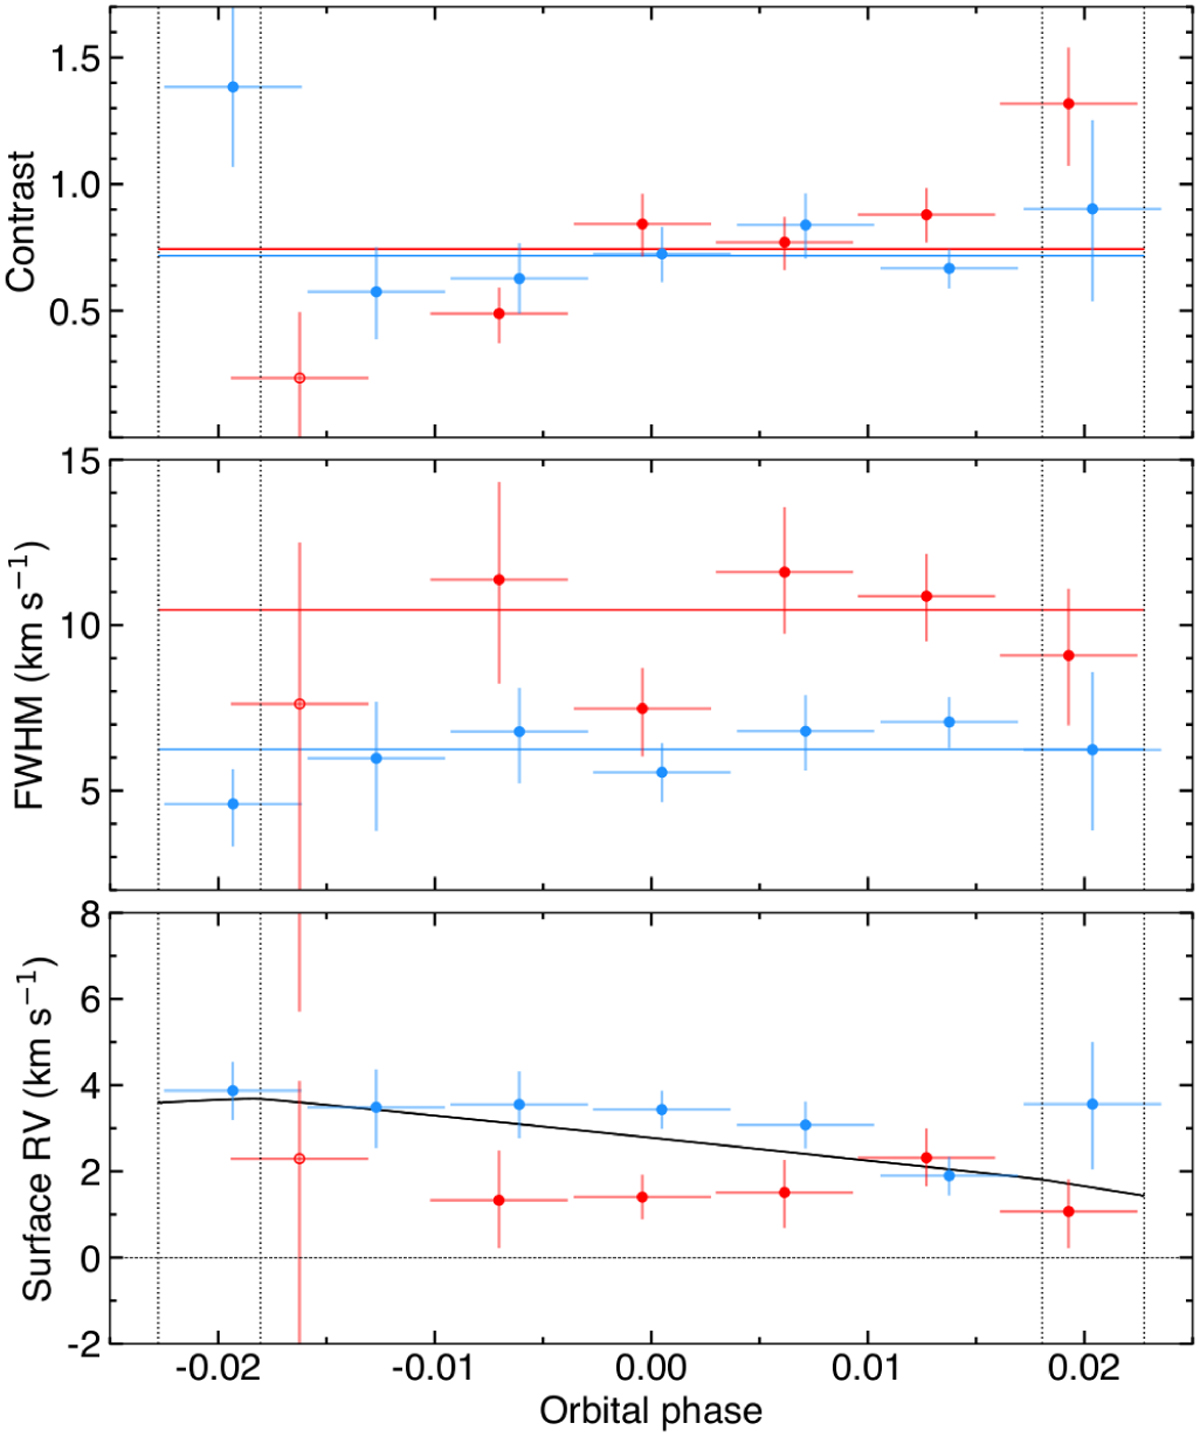
Properties of the stellar surface regions occulted by TOI-858 B b. in blue for Visit 1 and red for Visit 2. The dashed vertical lines are the transit contacts. The horizontal bars indicate the duration of each exposure. The vertical bars indicate the 1σ HDI intervals. The solid curves are the best models to each property, derived from a joint RMR fitted to both visits (excluding the first exposure in Visit 2). The RV model is common to both visits. The model contrast and FWHM are specific to each visit and are shown here after convolution of the model line by the CORALIE line spread function (LSF).
Current usage metrics show cumulative count of Article Views (full-text article views including HTML views, PDF and ePub downloads, according to the available data) and Abstracts Views on Vision4Press platform.
Data correspond to usage on the plateform after 2015. The current usage metrics is available 48-96 hours after online publication and is updated daily on week days.
Initial download of the metrics may take a while.