Fig. B.1
Download original image
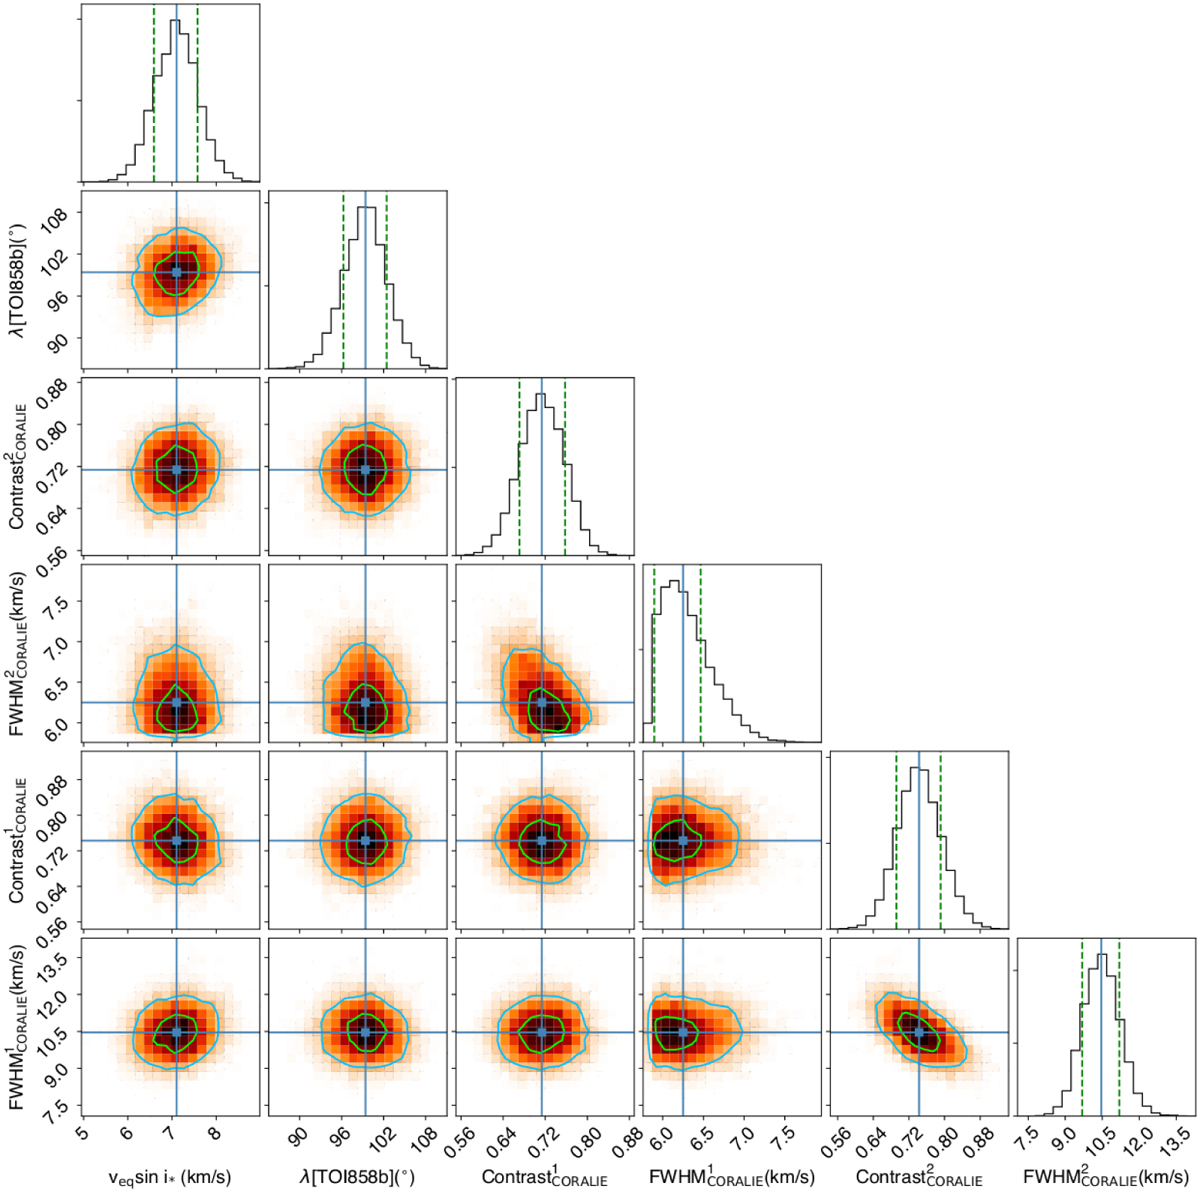
Correlation diagrams for the PDFs of the RMR model parameters. The CORALIE contrast and FWHM have been derived from the corresponding jump parameters to allow comparison with the observed line. The green and blue lines show the 1 and 2a simultaneous 2D confidence regions that contain, respectively, 39.3% and 86.5% of the accepted steps. The 1D histograms correspond to the distributions projected on the space of each line parameter, with the green dashed lines limiting the 68.3% HDIs. The blue lines and squares show median values.
Current usage metrics show cumulative count of Article Views (full-text article views including HTML views, PDF and ePub downloads, according to the available data) and Abstracts Views on Vision4Press platform.
Data correspond to usage on the plateform after 2015. The current usage metrics is available 48-96 hours after online publication and is updated daily on week days.
Initial download of the metrics may take a while.